Looking at the latest model data this morning, I wanted to take some time to give a heads up to everyone about the latest details with the forecast, as well as give you a better idea about what the CIPS Analogs mean.
Recall that the CIPS Analogs isn’t a model, necessarily, but instead takes the model data and compares it to actual situations in the past. It says, “Hey, the atmosphere has looked like this before… what happened the last time it looked like this?” And it does this for the top 15 most similar situations.
From there, it kicks out percentages, and averages for what we can expect.
After running through the overnight data, the CIPS Analogs kicked out some useful data on the percent chance, given what has happened in the past, that we see a severe weather report (in other words, a “severe” storm).
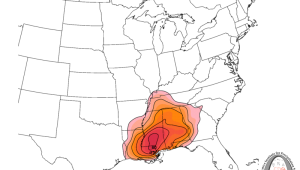
It concludes that, as we look back at similar situations, that 80% of the time (of the top 15 most similar situations) some of our counties (Walthall, Marion, Lawrence, Jeff Davis, Covington, Smith) see a severe weather report. That 80% also include sections of western Lamar, western Jones and western Jasper counties, too.
Okay, let’s clear up the confusion about the percentages, too. Because I know that saying “80% of the top 15 analogs” is almost meaningless without a frame of reference.
The good news, is this is some simple math (no derivatives!). All you have to do in this case is figure out is: What is 80% of 15? A Common Core style approach – and a simpler approach, in my opinion – is to think of it this way.
What is 80% of 10? 8
What is 80% of 5? 4 (since 5 is half of 10, the answer here will be half of the previous answer)
And, 8 + 4 = 12
So 80% of the top 15 Analogs means that 12 out of 15 times, when things look similar to this, there was at least one severe weather report.
That’s a pretty good bet.
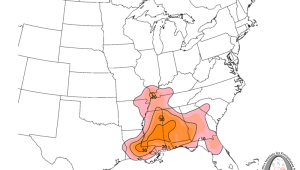
It also shows that in 30% of the top 15 most similar situations there is at least one tornado reported between our northern counties (Smith, Jasper, Clarke and Wayne).
Same math applies. What is 30% of 15? In this case it is about 5. We’ll round up since you can’t have a “half day” on earth. So 5 of the 15 times it looked similar to this there was a tornado.
Not as good of a bet, this that still seems like a decent chance.
So what does that mean? Does that mean the counties NOT listed are in the clear?
No. Not even close. Everyone in Mississippi has a chance for severe weather on Tuesday. Ev. Ree. One. All this shows is that certain places may be more prone – in similar situations – to see it.
Let me stress that again. Before you ask, “What about _____?” please know that you, too, have a chance for severe weather.
How do we know that? Well, it is shown by the percentages outlined by the CIPS Analogs shown above!
This is why I use CIPS whenever we are expecting bad weather. It does a great job at predicting what may happen because it compares it to what has happened before. Just like we do! Like, if your uncle overcooked the steaks on the BBQ one time at the 4th of July party ten years ago, but hasn’t since, you might say no biggie.
But if every other time you gave him a steak and a BBQ – the steak burned. You might start to think there is a pattern.
CIPS Analogs offers the same thing. It finds patterns in outcomes based on atmospheric situations. Neat stuff!


