I think this GIF was my reaction to opening up the SPC page this morning. Alex Puckett, a great meteorologist up in Huntsville sent me a message via facebook sharing his displeasure via meme.
We weather people are no different than anyone else. We live our lives through cat pictures, GIFs and internet memes.
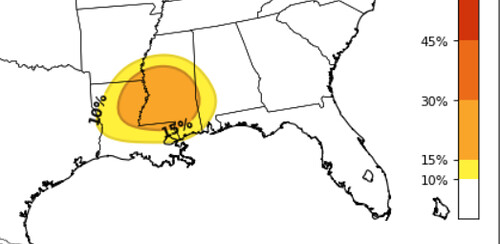
The changes from the SPC for Wednesday

…DISCUSSION…
…Wednesday (day 4)–central Gulf Coast into the Mid-South…
A mid-level shortwave trough is forecast to move from the Northeast into the Canadian maritimes prior to Wednesday with a mid-level ridge remaining over FL/Bahamas. As a result, a CP airmass will not likely not infringe on the central Gulf Coast prior to Wednesday. There is increased agreement in model guidance for the evolution of a well-defined mid-level shortwave trough forecast to eject northeast from the southern Great Plains into the OH Valley on Wednesday into Wednesday night. Models are in good agreement showing a previously stalled front advancing north across the Deep South, concurrent with a surface low developing/deepening as it moves northeastward from the northwest Gulf Coast and into TN/KY by early evening. Strong to very strong flow fields overspreading a destabilizing warm sector (featuring low-mid 60s F dewpoints as far north as parts of northern MS/AL) will support the potential for organized severe thunderstorms. In addition to a severe squall line, a supercell risk capable of all hazards is currently forecast.
The weather keeps acting like P. Diddy
During the next few days, little systems are going to glide by from WSW to ENE through parts of eastern Texas, southern Arkansas, northern Louisiana, northern Mississippi, northern Alabama and northern Georgia and most of Tennessee. This is going to open the door for potential flooding over parts of the region. The Weather Prediction Center has already pegged the region with a potential for 2- to 9-inches of rain.

Since all of this rain is going to fall over a few days, rather than all at once, flash flooding may not be as much of a concern. Sure, the rain will likely cause flash flooding in flood-prone places and low-lying areas, but the real threat may end up being river flooding downstream from all of the heavy rain.
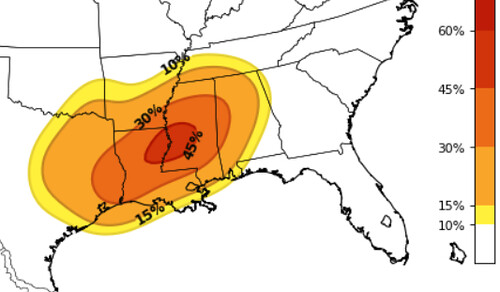
From the WPC for Monday

…Lower Mississippi Valley across the Lower Tennessee Valley into the Southern Appalachians…
Strong short wave energy closes off as it drops across Southern CA to a position off the northern Baja Peninsula by the end of Day 2. Short wave energy ejected from the closed low rides along a slow moving front extending from the Southern Appalachians into the Lower MS Valley, providing synoptic scale ascent for heavy rainfall over areas that received flooding late last week. There is more model spread than yesterday at this time, and there has been a slow creep northward with the axis of highest rainfall across MS/AL/GA into SC. With this in mind, the WPC QPF and Excessive Rainfall Outlook were based on a blend of the 00z
ECMWF/GFS, which form a consensus concerning the placement of the rainfall maximum.As the closed mid level low settles just off the Southern CA coast during the second half of Day 2, the west southwest mid level flow becomes increasingly parallel to a slow moving front extending from the Mid Atlantic Coast to the western Gulf of Mexico. Ahead of the boundary, a 45/55 knot low level west southwest flow sends 1.50 inch precipitable water air (which is between two and three standard deviations above the mean) along the front, peaking after 11/00z. Within the moisture plume, model soundings showed 500/1000 J/KG of MUCAPE extending from eastern LA into west central GA. The combination of moisture and instability should be sufficient to support low topped convection along the front.
Convection is expected to be ramping up along the front (on the northern edge of the instability gradient) across AR into northern MS and northern AL into the early afternoon hours. Hourly rainfall rates could approach an inch in these locations, as short wave energy provides synoptic scale ascent to support low topped convective clusters. The next round of convection is expected along the front after 11/00z, with 250/500 J/KG of MUCAPE in the moisture plume (where the IVT values are near climatological maxima). The combination of moisture and instability can support hourly rainfall rates as high as 1.50 inches, especially where short term training occurs (as cells travel southwest to northeast along the front as it drops slowly south). The activity is expected to peak between 11/06z and 11/12z.
Over the Southern Appalachians into northern AL, three hour flash flood guidance values are as low as 1.00/1.50 inches, as these areas received more than 300 percent of normal rainfall in the past week. There are still rivers in flood here, with soils remaining nearly saturated. Though rainfall amounts here are lower than further southwest, the impact here could be greater because of the antecedent conditions. Based on this, a Moderate Risk was placed here to highlight the enhanced flash flood risk.
Further southwest, extending from northern Al across northern and central MS into northern LA, the antecedent conditions are not
quite as wet, with the bulk of the heaviest rain with the last event occurring further northeast. However, the model signal here
is stronger for 3.50/4.50+ inches of rainfall, along the best instability gradient. Based on this, the Moderate Risk was extended across northern AL into northern and central MS for Day 2.
The Setup for Wednesday
Through about 60 hours, the pattern is pretty locked in when looking between all of the model data available. That means that between 11 different models, they’re all saying – roughly – the same thing.
The above image is a slideshow of 500mb geopotential heights maps between all of the model data. It is showing what it thinks the atmosphere will look like up at about 20,000ft. Notice the circle near Arizona. That is a “cutoff” area of low pressure. Most models think that the area of low pressure dives – nearly – due south from the Pacific NW into the Desert SW. Once there, it gets “cutoff” from the main jet stream for a short period.
How short of a time period? Does it stay stacked when it leaves? What is the definite path it takes as it leaves? How strong is it as it goes?
These are all questions to which no one has definitive answers. Yet.
But, looking at the available data we can still make estimations and predictions.
Looking just 12 hours further into the future from when all of the models were in pretty good agreement, the above GIF highlights the “difference in opinion” between the guidance.
Some models think is stays vertically stacked, others think it gets pulled back into the main flow as an elongated, positively-tilted shortwave trough, others think it stays “cutoff” but just drifts a bit further northeast.
Either way you slice it in the mid/upper levels, there is some consistency between the lower-to-mid levels and the upper levels. At 200mb, the region will be clipped by the tail end of a southwesterly-tilted Jet Streak (different than the Jet Stream). While in the lower-levels, down at 850mb, the region will be under the influence of a strong southerly flow.
With that type of “architecture” or “structure” setup in the atmosphere, the means there will e a sufficient background environment capable of maintaining severe weather. The question now becomes, can we produce it.
For that we need to know something about the surface dewpoints and the 500mb temperature. If there is enough of a difference between the surface dewpoint and the 500mb temperature, then there can be severe storms. In this case, the difference is – in general – about a 25-degree Celsius difference. Enough. Not ample, but enough.
CIPS Analogs
The CIPS picked up on the threat for severe weather near mid week a few days ago. Here is a snippet pulled from its “Day 8” guidance:
This was originally showing a severe weather threat for Thursday. That was back up by other CIPS guidance pulled from the GEFS as well as other operational guidance from the GFS and ECMWF.
But the threat eventually migrated back to Wednesday. As of today (Sunday), this morning’s guidance from CIPS looked like this:
CIPS Shows a pretty decent chance for severe weather across parts of Louisiana and Mississippi. A 30-percent severe risk would line up with Enhanced or Moderate from the SPC. Compared to last week’s severe weather, the CIPS showed a 45-percent severe weather risk four days out. So, CIPS has a history of correctly identifying a threat for severe weather, but may not be as great with a specific chance for seeing a severe storm.
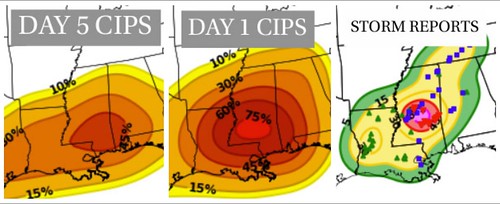
Above is the Day 5 vs. Day 1 vs. Storm reports. You can see that it does a pretty good job at highlighting the area of concern.
The Timeline on Wednesday
Right now it looks like a midday event for eastern Louisiana and southern Arkansas. An afternoon event for central and northern Mississippi. An afternoon and evening event for southern Mississippi and western Alabama.
What types of severe weather will be possible on Wednesday
All modes of severe weather will be possible. As well as the weather that accompanies severe weather. That means storms will be capable of producing heavy rain, frequent lightning, wind gusts up to 65mph, hail up to the size of quarters, and the potential to produce a tornado.
I know there have been tweets and facebook posts suggesting some kind of tornado outbreak, but that just isn’t a knowable thing yet. It is more hype than anything else.
The Forecast for this week
Monday there will be the chance for a severe storm or two along and south of I-20. Along I-20 and to the north, heavy rain and flooding also be a concern. Generally this will be a rain and wind event for almost everywhere. The tornado threat should remain reasonably low.
Tuesday will feature lingering showers.
Wednesday the next system moves through with a chance for showers, storms and severe weather across the region. This is when all modes of severe weather will be possible.
What about where I live, Nick? Will it be bad for my town?
No one can know specifically where a tornado will happen this far in advance. Nor can anyone predict if one town will get a regular storm while the other town gets a severe storm. But, if you live in a town that is anywhere inside the yellow- or orange-shaded areas on the map below, plan like your town is expecting “bad” weather.
If you don’t know where you are located on a map, use the map below – supplied by google – to search for your town:
Then compare where your town is located to the map above to see if your town is inside of the shaded areas.
Things you can do to prepare now
Check your severe weather plan. Where do you plan on being Wednesday during the severe weather threat? Make sure you know what you would do if a warning was issued for your area. Have a safe place to take shelter where ever you are located.
Have a kit with supplies to help you after a storm, should the worst happen. A flashlight, whistle, and water should be in the kit.
The next update?
I’ll try to post another update Monday morning – but only if things have changed drastically enough to warrant an update. If things are still looking similar, I may wait until Monday night or Tuesday morning to post another update.


