Colorado STate produces a hurricane forecast every year. You may ask, what do scientists in Colorado know about hurricanes?
You’d be surprised. Philip J. Klotzbach, Michael M. Bell, and Jhordanne Jones are quite good at what they do.
What is the scoop
According to the research, Klotzbach and his team suggest an “Above Average” season.

The team cites the transition of the current (very weak) El Nino conditions toward (very weak) La Nina conditions by fall as part of the reason. That transition will help keep water temperatures warmer in the early part of the hurricane season, but relax the vertical wind shear as we move through Summer. And speaking of water temperatures, those are running above normal across the Atlantic. Closer to the Gulf Coast, the Gulf of Mexico is running between 1-degree and 3-degrees (Celcius) above normal.
The one note the team did make is that the likelihood of a US landfalling Major Hurricane is up this season.
Under the hood
This is the 37th year that Colorado State has produced a forecast. Klotzbach and his team looked at multiple different parameters to come up with this early-season prediction. This isn’t a set-in-stone forecast, though. Even they admit the early season prediction has its limitations and only provides, “modest long-term skill.”
This forecast is based on a new extended-range early April statistical prediction scheme that was developed using 38 years of past data. Analog predictors are also utilized. We are also including statistical/dynamical models based off data from both the ECMWF SEAS5 model and the Met Office GloSea5 model as two additional forecast guidance tools. We are also including probability of exceedance curves to better quantify the uncertainty in these outlooks.
The early April forecast is the earliest seasonal forecast issued by Colorado State University and has modest long-term skill when evaluated in hindcast mode. The skill of
CSU’s forecast updates increases as the peak of the Atlantic hurricane season approaches. For the first time this year, we are also presenting probabilities of exceedance for hurricanes and Accumulated Cyclone Energy to give interested readers a better idea of the uncertainty associated with these forecasts.
The team looks at more than just global sea-surface temperatures and past years climatology. The early-season prediction uses a combination of multiple factors from sea-surface temperatures in the Atlantic basin as well as sea surface temperatures off the coast of Australia combined with the upper-level winds across parts of teh Atlantic to the north of the inter-tropical convergence zone off the coast of Africa.
From there, the researchers drop that information into a four-panel display:
For each of these predictors, we display a four-panel figure showing linear correlations between values of each predictor and August-October values of sea surface temperature (SST), sea level pressure (SLP), 200 hPa zonal wind, and 850 hPa zonal wind, respectively, during 1982-2019. In general, higher values of SSTs, lower values of SLP, anomalous westerlies at 850 hPa and anomalous easterlies at 200 hPa are associated with active Atlantic basin hurricane seasons.
As a quick example, previous research has shown that when there are warmer-than-normal sea-surface temperatures in the tropical and subtropical Atlantic during the January-to-March timeframe, that is linked to a weaker-than-normal subtropical ridge of high pressure. And that means a reduced trade wind during the spring.
So, according to Klotzbach, “positive SSTs in January-March are correlated with weaker trade winds and weaker upper tropospheric westerly winds, lower-than-normal sea level pressures and above-normal SSTs in the tropical Atlantic during the following August-October period.”
He notes that all three of these are commonly associated with active hurricane seasons. Why? Well, the warm water increases vertical instability, the weaker trade winds reduce vertical wind shear, and the increased instability and water temperature with a weaker tropospheric werterly means more mid-tropospheric moisture.
Additional data this year
For the first time, that I can remember, at least, the team has released an exceedance chart. The idea here is a look at what are the probabilities that a certain forecast is met, and/or exceeded.
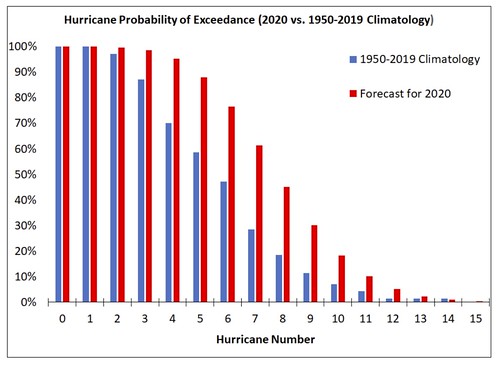
A quick way to read this is that every year since 1950 there was at least one hurricane. So there is a 100-percent chance (blue line), based on history, that one-or-more hurricanes occur. There is a 85-percent chance (blue line), based on history that three-or-more hurricanes occur. This year, though? There is a greater than 95-percent chance red line) that three-or-more hurricanes occur.
You can follow the line down and find that there is around a 20-percent chance that 10-or-more hurricanes occur.
It is a good way to build a range of possibilities. And this is how the rest of the science world works, anyway. Science is all about probabilities and exceedance values. That is why it isn’t too often that a meteorologist can tell you there is a 100-percent chance for rain at one spot at one time.

The team then added an uncertainty range within their outlook. Showing numbers that look a little more like the NOAA outlook that comes out later this Spring. It has a range of potential outcomes.
Where are these storms most likely to occur?
I won’t lie to you and tell you that I understand how they get these numbers. I’m still looking into that. But based on my quick read-through, these probabilities are based on past events given atmospheric conditions rather than a direct forecast from atmospheric conditions.
| Historical Probabilities (1878-2017) | 2020 Probabilities | |||
| State | Hurricane | Major Hurricane | Hurricane | Major Hurricane |
| Texas | 33% | 12% | 47% | 19% |
| Louisiana | 30% | 10% | 43% | 16% |
| Mississippi | 11% | 4% | 17% | 6% |
| Alabama | 11% | 3% | 17% | 4% |
| Florida | 51% | 21% | 68% | 31% |
You can see that along the Gulf Coast, there is an increased likelihood, according to their research, that a hurricane will strike this year than any other average year. That shouldn’t be a big surprise, though, given the forecast for an active season.
That’s great, but how accurate are they?
There is this debate. And based on the last five years of data, I was surprised by the outcome.
| Prediction | 2015 | 2016 | 2017 | 2018 | 2019 |
| Storms | 7 | 13 | 11 | 14 | 13 |
| Hurricanes | 3 | 6 | 4 | 7 | 5 |
| Major Hurr | 1 | 2 | 2 | 3 | 2 |
| Actual | 2015 | 2016 | 2017 | 2018 | 2019 |
| Storms | 11 | 15 | 17 | 15 | 18 |
| Hurricanes | 4 | 7 | 10 | 8 | 6 |
| Major Hurr | 2 | 4 | 6 | 2 | 3 |
| How different was Actual | 2015 | 2016 | 2017 | 2018 | 2019 |
| Storms | 157.14% | 115.38% | 154.55% | 107.14% | 138.46% |
| Hurricanes | 133.33% | 116.67% | 250.00% | 114.29% | 120.00% |
| Major Hurr | 200.00% | 200.00% | 300.00% | 66.67% | 150.00% |
It looks like they under-forecast more often than not. And that surprised me.I figured tat some years it would be lower, others higher, not all-but-one-category-shows-higher.
So, for those who think early season predictions like this are just “hype” and the season won’t be active because “they’re just doing this to get attention” I suppose that during the last five years that hasn’t been the case at all. Because they’ve come in too low in almost every category across the board.


