Summer is officially over. And across southern Mississippi the temperatures are starting to ease back into the 80s for afternoon highs and dip into the 50s overnight. That means that severe weather isn’t that far away.
As apart of my continued attempt to immerse myself in southern Mississippi weather, I decided to stick my nose in the history books. A wise man once said it is a lot easier to find out where you’re going if you know where you’ve been.
So, I set out to gather the records of every tornado to hit the Pine Belt since 1950.
Looking at the record book from the National Weather Service offices in Jackson, Mississippi, Slidell, Louisiana and Mobile, Alabama as well as the Storm Prediction Center, the following tornado numbers reflect information on years between 1950 and 2012.
After I piled up the data, I broke it down by county and by season. For me, despite the fact that we are heading into October, I was more interested in spring tornadoes. So from 1950 to 2012 for the month of February through June, this is what I found.
| County | Spring Tornadoes Since 1950 |
| Smith | 27 |
| Jasper | 24 |
| Clarke | 13 |
| Jeff Davis | 12 |
| Covington | 19 |
| Jones | 26 |
| Wayne | 13 |
| Marion | 13 |
| Lamar | 8 |
| Forrest | 18 |
| Perry | 11 |
| Greene | 16 |
| Pearl River | 28 |
| Stone | 9 |
| George | 9 |
There have been 246 tornadoes between February and June from 1950 to 2012. Of those 246, 28 were in Pearl River county, 27 were in Smith county and 26 were in Jones county.
Given the data collected this is the average chance of a tornado per year, by county:
| County | Average Chance of Tornado Per Year |
| Smith | 43.55% |
| Jasper | 38.71% |
| Clarke | 20.97% |
| Jeff Davis | 19.35% |
| Covington | 30.65% |
| Jones | 41.94% |
| Wayne | 20.97% |
| Marion | 20.97% |
| Lamar | 12.90% |
| Forrest | 29.03% |
| Perry | 17.74% |
| Greene | 25.81% |
| Pearl River | 45.16% |
| Stone | 14.52% |
| George | 14.52% |
Those numbers might seem very high. And they might even be a tad alarming, but I have good news. Those are numbers looking backwards in time, and are not a prediction. Plus most of the tornadoes are EF-0 or EF-1 tornadoes that so very little damage and aren’t near people or towns.
Speaking of tornado size and strength, here is a look at the length, size and strength of each tornado broken down by county.
| County | Average Path (mi) | Average Width (yards) | Average Strength (F/EF scale) |
| Smith | 10.07 | 274.67 | 1.48 |
| Jasper | 13.81 | 350.21 | 1.75 |
| Clarke | 12.00 | 317.69 | 1.69 |
| Jeff Davis | 8.48 | 133.00 | 1.42 |
| Covington | 12.42 | 192.37 | 1.32 |
| Jones | 7.09 | 220.31 | 1.50 |
| Wayne | 9.37 | 228.46 | 0.54 |
| Marion | 7.28 | 208.46 | 1.00 |
| Lamar | 5.87 | 203.75 | 0.63 |
| Forrest | 3.17 | 138.89 | 1.06 |
| Perry | 8.51 | 150.27 | 1.18 |
| Greene | 10.94 | 200.63 | 1.56 |
| Pearl River | 4.41 | 63.63 | 1.00 |
| Stone | 1.90 | 42.22 | 0.89 |
| George | 7.33 | 77.56 | 1.89 |
What is really cool about this is you can start to make comparisons between places. Notice that Pearl River county had a 45 percent chance of a tornado. That might seem really high, and almost frightening. But when those tornadoes are compared to the length, size and strength of tornadoes in Clarke county, Pearl River county my be more desirable.
For Pearl River the average tornado only went about four and a half miles and was only about 60 yards across and was – on average – an F/EF 1. While in Clarke county the tornadoes were on the ground nearly three times longer, were nearly six times larger and were almost three-quarters of a category higher on the F/EF scale.
| County | Average Occurrence / Year | Average Path (miles) | Average Size (yards) | Average Strength (F/EF Scale) |
| Clarke | 20.97% | 12.00 | 317.69 | 1.69 |
| Pearl River | 45.16% | 4.41 | 63.63 | 1.00 |
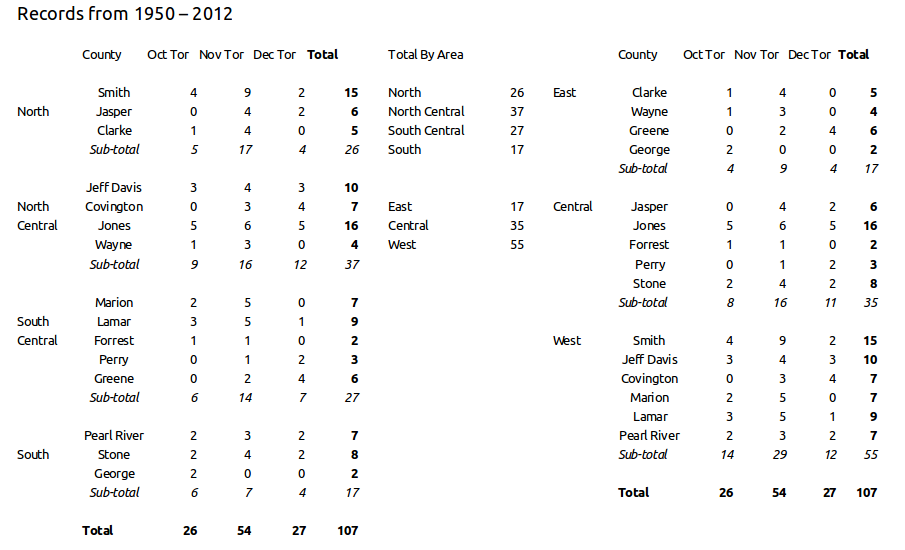
Remember, that is for the Spring season only. What about fall? Well, the fall severe weather season isn’t as robust. In fact, the number of reported tornadoes in October, November and December isn’t even close! But, since we are moving into the “mini” severe weather season in the fall here is a look at those numbers.
Again, I want to stress that this isn’t a forecast or prediction. And this can’t be used – alone – to predict the size of a tornado. Nor can it be used to tell when, where or even if a tornado will develop or where s tornado is more likely to develop. Most of those factors – on a scale this small – are more dependent on the atmospheric setup on a storm to storm basis rather than topography or climate.
But it can be useful in severe weather situations as another tool to help forecasters understand what to watch out for and to help inform you about what to expect.


