I won’t bury the lede here: It is looking like an active Hurricane Season is in the cards for the summer of 2024. Here is a look at the outlook for the entire Atlantic Basin as well as just the Gulf of Mexico.
Some FAQs…
“Don’t they predict a high number every year?”
Depends on who “they” you’re referring to, but no, any reputable “they” you are thinking of does not. Colorado State usually undercuts their early season predictions and shot for the moon this year with a well-above normal year. NOAA often is very conservative with their forecasts, too, but this year predicted an very, very active season.
But prior to the last few years – which have been very active – both CSU and NOAA often predict a near normal or below-average year and certainly don’t have a history of predicting seasonal numbers around 20 storms historically.
“What do people in Colorado know about hurricanes?”
Enough to live in Colorado! Jokes aside, often when Universities become “good” at a thing, it isn’t due to a proximity to said thing. It can be, but not always. Often what happens is a very good set of researchers happen to end up in the same place researching the same thing and get notoriety for doing such a good job.
“Why are your numbers different?”
Many outlets have different forecasts because we all use different methodologies for creating a forecast. My blend of data is going to be a bit different than anyone else – a bit like any other weather forecast. Because of that, my numbers may be a bit different.
“Will a Hurricane hit my house this year?”
No one can know that, sadly. We can try to estimate when certain regions or larger areas may have a chance for seeing a tropical system, but specifically nailing down which cities or neighborhoods will get hit by a hurricane can’t be done — no matter how much someone wants to sell that to you.
Okay! So!
There is a lot that went into this. And if you’d like to know how I went about getting to these numbers, enjoy the rest of the post! If you just want to know the forecast – as always – the bottom line is the final section!
A quick point of clarification: I used a lot of data for June through September (and not OCtober) because I needed a 1-to-1 to run a lot of the statistical analysis with early in the year data. And since we haven’t gotten to the end of May yet, I had to omit May as a month, so I was left with January to April. So I was thus limited to June through September.
BRIEF HURRICANE SEASON HISTORY
I went back to look at how the Hurricane Season has changed since 1990. Why 1990? Because we are currently using the “30 year normals” in the weather community that run from 1991 to 2020. And I thought, well a good round number of 1990.
Then I grabbed the running 5-year average for the number of tropical systems in the atlantic, broken down by Tropical Storm, Hurricane and Major Hurricane.

I hear from a lot of folks that the National Hurricane Center has seemed to name everything that spins the last few years. I can’t argue that it does seem like things that used to go unnamed are now being classified, but I also know that our tools to determine the characteristics of a tropical system via satellite are much more advanced and skilled today compared to 30 years ago – so part of the “everything gets a name” is that we can simply see these systems better now than before (it is a bit like how our skill at finding tornadoes in severe weather has improved a ton since 1990, too).
So I wanted to see if naming a tropical system was well correlated with that named system strengthening to become a hurricane.
They are correlated, but not well. It looks like the number of named systems is growing at a faster pace than the number of hurricanes and major hurricanes in a given season.
What does that mean?
It means that we can find them easier to name them, but once they get big enough, we see them all the same today as we did back in 1990, so the growth year-to-year of the Hurricanes and Major Hurricanes is likely slower – but certainly still growing.
In fact, the numbers suggest that we gain an extra hurricane per season every decade.
Looking at the numbers clustered into 5 year blocks, that plays out pretty well.

It also shows that we are gaining about 1 extra hurricane per season every decade as well as 1 extra Major Hurricane per season every 15 years.
Interested in the Gulf in particular? I knew you were….
Looking at tropical systems entering the Gulf (since 2000), we can see a a pretty steady stream of 5 to 8 tropical systems (TS) but more variability for Hurricanes (H) and Major Hurricanes (MH). With the Major Hurricane data showing a bit of a bimodal distribution.

Comparing the counts for Hurricanes by year going back to 2000, generally we can expect between zero and two hurricanes in the Gulf on any given year. With those numbers quite a bit higher since 2016.

Part of the jump since 2016 has to do with very active years in 2020 and 2021, but also one of the underlying causes of those two blitzkrieg seasons: warmer Gulf waters.
THE GULF IS HOT
In fact, the entire Atlantic is warm. Almost everywhere.

And the biggest problem with a warm Atlantic is there isn’t really a year-to-year mechanism to cool it down. It has decadal changes, but year-to-year not much changes. So this warmer-than-normal water isn’t going anywhere anytime soon.
The Gulf of Mexico water temperatures are also – generally – nearly as warm or warmer than it’s ever been recorded. Perhaps not specifically, day-to-day, but generally over a month or a season, the Gulf is running well above normal. We’ve come a long way since they has icebergs floating off the coast of New Orleans back in the 1700s (it happened!).
At this point, I don’t we’ve got an icebergs chance in You-Know-Where of seeing a chilly Gulf of Mexico in our lifetime. It has too much stored heat.
And, at this point in the year, it is generally warmer than it was at this time last year, too.

And looking in the Main Development Region of the Atlantic, there is plenty of warmth there, too.

In fact, depending on how you draw out the map, there is some indication that we are running as warm in the waters of the Atlantic today than we have at the peak of Hurricane Season on any other given year.
It is pretty incredible.
LOOKING AT HISTORICAL PARAMETERS
I tend to use a fair bit of analog guidance in my forecasting because often times, “what has worked before, will work again” when it comes to atmospheric science – and all of physics. So blending computer model guidance with some statistical analysis and a load of analog guidnace is usually how I settle on any seasonal outlook.
In this case I looked at the following parameters:
Sea Surface Temperatures
ENSO
250mb Meridional Wind
250mb Zonal Wind
250mb Geopotential Heights
500mb Geopotential Heights
1000mb Geopotential Heights
700mb Relative Humidity
850mb Zonal Wind
850mb Geopotential Heights
And I compared these parameters from January through April to June through September. I wanted to get an idea of the correlation between the parameter space between Winter, Spring and Summer. And then I also looked at the relationship between these parameters and the development of a tropical storm.
Here is a look at the charts:


Whew! That’s a lotta’ charts!
What does it all mean? Well, we can look at this to try and see if there is a good fit to the spread in the correlations between Jan-Apr values and Jun-Sept values. So we compare the values below to the spread on the charts above.
| PARAMETER | COR. | PARAMETER | COR. |
| SST | .69 | 500MB GPH | .73 |
| ENSO | .28 | 1000MB GPH | .50 |
| 250MB M WIND | .21 | 700MB RH | .46 |
| 250MB Z WIND | -.36 | 850MB Z WIND | .38 |
| 250MB GPH | .70 | 850MB GPH | .50 |
What we can see is that in many cases there is a reasonable relationship between what happens in January through April to what happens from June through September.
We can then look at how the numbers in June through September relate to the development of tropical systems.
| PARAMETER | COR. | PARAMETER | COR. |
| SST | .52 | 500MB GPH | .37 |
| ENSO | –.36 | 1000MB GPH | -.61 |
| 250MB M WIND | .06 | 700MB RH | .44 |
| 250MB Z WIND | .39 | 850MB Z WIND | .55 |
| 250MB GPH | .51 | 850MB GPH | .32 |
We can then compare those numbers above back to the charts above, too. We can use the equations for the trend lines on each chart to make an estimation about the upcoming summer based on more than 30 years of data.
We look at the January to April data, grab the equation of the trend line and then apply it to solve for the June through September temperature. While the R-squared value isn’t particularly high for the given data set, we are comfortable with the looseness because we are trying to develop a range, by finding our specific number.
Hey kids, remember when you asked, “when am I going to solve for X or use any of this slope stuff? Welp, right now!
We then pivot and do the same thing with the Summer value and the number of Tropical Systems.
We can then chart the numbers of tropical systems (orange bars below) for each parameter with the relative impact on the forecast given the correlation each parameter has to development of tropical systems weighted for the total number of parameters and how each impacts development.

Looking at the chart, we can see that SST, 250mb GPH, 1000 GPH and 850mb Z Wind are the biggest impactors to the forecast model.
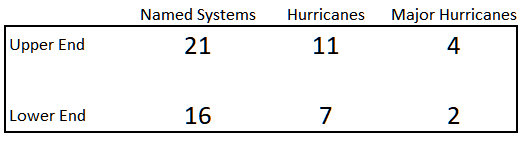
If we do all of this we get:
| TS | H | MH | |
| upper range | 20 | 11 | 4 |
| lower range | 15 | 5 | 2 |
So, about 15 to 20 named storms with 5 to 11 Hurricanes and 2 to 4 Major Hurricanes. A stout season.
But we aren’t done.
LOOKING AT ANALOG GUIDANCE
Analogs are great. Basically we just look back in time and ask, “Hey remember when it looked like this before? What came next?”
Comparing how this year looks to previous years based on how closely this time of year resembles previous years is a good way to shake out what may happen during any given season. I will say, though, that as our climate continues to change – and that change is accelerating – our modeling for “what is possible” continues to break down. But that is for another post.
For this season, I took all of the parameter data and looked at the standard deviation between each value for each month for each year. And then grouped up our months into seasons and then grouped them into clusters.
The January through April cluster was one and the June through September cluster was another.
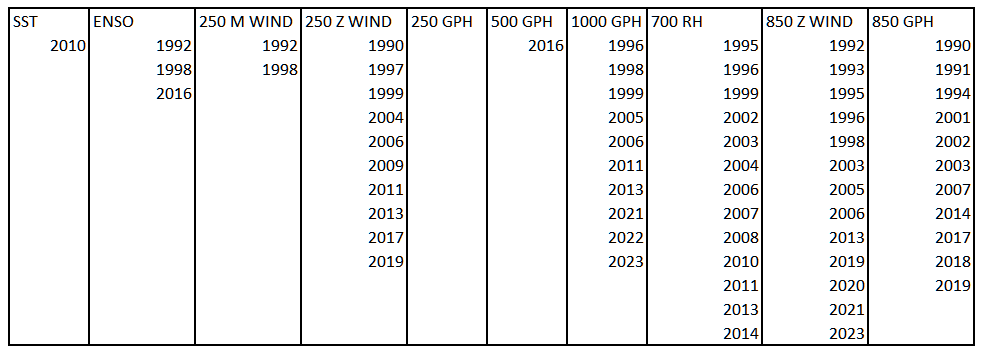
And when you look at the analogs for January through April, you get some parameters with a ton of analogs and others with a few or none.
And “No Analog” is a dangerous place to be because then we don’t have a good way to say, “well the last time this happened, what came next?” because this has never happened before.
Looking at the table, not all analogs are created equal. Some years better resemble others. So we weight them based on how many times they show up.
Then we look at our parameters that are the biggest forecast impactors and weight those. And then we look back at each year and count up the storms for a given analog weighting and we get another forecast.
| TS | H | MH | |
| upper range | 16 | 8 | 4 |
| lower range | 11 | 5 | 2 |
A little less robust, but still an active season with nearly the same number of Hurricanes and Major Hurricanes.
WEIGHTED 5-YEAR ANALOGS
Given that things are much different across the oceans and atmosphere today compared to 30 years ago, I wanted to take some time to really drill down on the last 5 to 10 years. And I settled on the last 5 years given some of the things that have happened to the atmosphere and oceans globally.
We’ve seen a pretty stout El Nino and the Honga Tonga eruption in the last few years alone. On top of that the Atlantic Multi-Decadal Oscillation has allowed the Atlantic Ocean to become quite warm compared to a decade ago. Along with some other stuff, too!
But all of that to say, “I am using the last 5 years”
And if we say, “Okay, the last five years is the new normal.” and then we go from there, we can see what happens. And when you do that and you look back at the parameter space, and the analogs, and then you weight the values against the average for the last five years relative to the last 30 years, based on the last five years of data, you get a slightly different forecast.
| TS | H | MH | |
| upper range | 24 | 12 | 5 |
| lower range | 19 | 9 | 3 |
That is a range of 19 to 24 named storms, 9 to 12 Hurricanes, and 3 to 5 Major Hurricanes. A very busy season.
PUTTING IT ALL TOGETHER: THE BOTTOM LINE
Looking at all three ways I’ve attacked this seasonal outlook, you can line everything up and then start slicing and dicing.
Here is a look at the forecasts and how they compare to each other.

When you weight those based on my proprietary weighting system you get the following forecast:

That is a forecast for 18 named storms total, 9 of which are Hurricanes, and 3 being Major Hurricanes.
That includes a forecast for 5 named systems in the Gulf, with three being Hurricanes and 1 Major Hurricane.
So how did I figure out the Gulf part? That is a bit of “secret sauce” that I’ve used for the last five years, but it has to do with how each season historically looks compared to the overall setup anticipated for Summer.
Please note that this forecast is being done in May. And is likely going to need to be changed as the data for May and June come in and we get a better idea about the state of the atmosphere as we get into Hurricane Season.
EXTRA: WHERE CAN THIS FORECAST FAIL?
Many places. I do have a few questions about this upcoming season and how it plays out.
When you look – very generally – at what makes an El Nino and La Nina impact hurricane season, it is often just energy transfer and mass balance. Look at the – very artistic – graphics I drew below.

The top example, a warm Pacific and cooler Atlantic, shows more low-level wind moving from east to west and thus a stronger wind aloft from west to east. This is part of the “extra shear” equation during an El Nino across the Tropical Atlantic.
But when we flip that, during a La Nina, we then get a bigger push to the east in the lower levels and a stronger kick to the west in the upper levels, this lowers shear.
And we have done that for the last 50 years with an Atlantic Ocean that is some 1 to 4 degrees cooler than it is today.
You may say, “Nick, that sounds pretty insignificant.” But, mathematically, it isn’t. When the threshold for building and sustaining a Major Hurricane can teeter on the depth of the 26C isotherm. And as we warm the surface waters and the ocean then “turns over” and mixes that warmer water down, we push the depth of the 26C isotherm deeper and deeper.
On top of that, I also found during my research that a stronger west to east component at 850mb increased the potential for more tropical systems.
And we have seen in recent years than storms “venting” in the upper levels downstream can help mitigate shear and condition the overall environment to maintain a hurricane. And the extra shove aloft as depicted in the middle frame would accomplish both of the things I just mentioned.
And I think that is part of the reason the forecasts from others may be a lot higher than mine and why I may need to revisit this later in the season.
But I also wonder if there is a particular unknown threshold of forward momentum that we may be up against this year. And is the mass balance that will be at play going to create African Waves that are simply moving too fast aloft to organize themselves.
I don’t know. But it is something I wonder about.
The last frame in the graphic above shows a warmer than normal Pacific AND Atlantic. And this is where I think we may be, too, for the start of Hurricane Season, which may lead to ‘other factors’ at play and may limit the activity at the start of Hurricane Season.
This may give us a false sense of security before the top gets blown off at some point. But when that happens and if that happens is still TBD.
Just know that there are places in this forecast where I could see me being wrong – in both directions.


3 thoughts on “2024 NickelBlock Forecasting Atlantic / Gulf Coast Hurricane Season Outlook”
Comments are closed.