I can hear some of you now: “Oh boy. Here Nick goes again!”
Guilty as charged!
I went down a bit of a rabbit hole this morning trying to shake out some of the Christmas Week trends for the region. I looked back at data to 1950. This was a blend of NWS and reanalysis data.

Let’s take a journey back in time!
THE COLDEST CHRISTMAS WEEK
Thinking back, some of you might say,0″ holy moly, 2022 Christmas week was coooooold!”
And you’re right! It was pretty cold. We woke up on Christmas Eve morning and Christmas morning with temperatures in the teens and 20s across much of the area – even down close to the coast!
This is what the forecast looks like for DEcember 23rd, 2022!


It was the coldest Christmas week we’d seen since 2004. But looking back, there were five Christmas weeks that had colder temperatures on average.
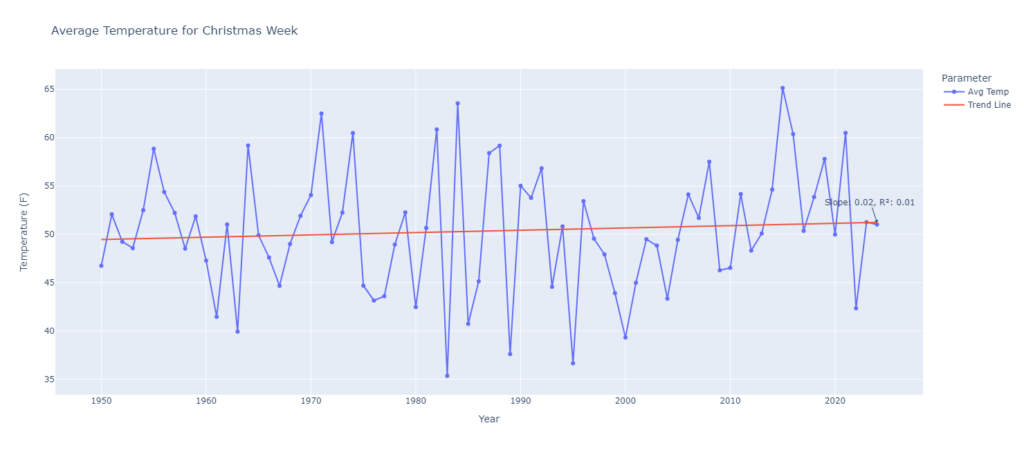
Looking back through the data, the years 1995, 1989, 1985, 1983, and 1963 were all colder than 2022.
Back in 1983 is was downright brutally cold! Here is a look at the average regional temperatures per day from reanalysis data:
12/21/1983 50.52
12/22/1983 48.81
12/23/1983 34.75
12/24/1983 24.46
12/25/1983 15.06
12/26/1983 21.65
12/27/1983 39.2
12/28/1983 56.42
12/29/1983 34.17
That was some serious pipe-bursting cold!
THE WARMEST CHRISTMAS WEEK
On the opposite end of the spectrum, the Christmas week of 2015 was balmy. In fact, it was almost tropical by comparison!

Here is a look at the average regional temperatures for that week
12/21/2015 59.25
12/22/2015 65.34
12/23/2015 66.85
12/24/2015 70.55
12/25/2015 70.8
12/26/2015 72.65
12/27/2015 72.91
12/28/2015 68.05
12/29/2015 54.02
That was a unique year because we had the potential for severe weather on December 23rd (the one-year anniversary of the 2014 tornado in Columbia, MS) but we never really cooled down like we typically do after storms. Instead, Christmas Day was particularly warm that year, with many folks seeing high temperatures in the 80s that day.
The second-warmest? Well it was the year right after the coldest. In 1983 we had the coldest year, and then we rebounded the next year with (at the time) the warmest on record. That record held until 2015. But in 1984 parts of the area topped out around 80-degrees in some spots, too.
THE TRENDS & AVERAGES
You might be wondering if there is any trend to Christmas temperatures or what an ‘average’ Christmas might look like.
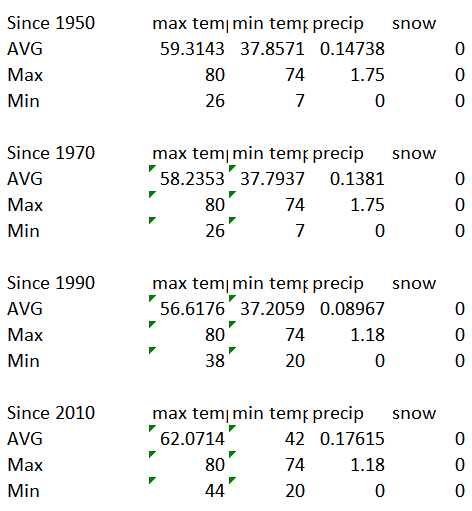
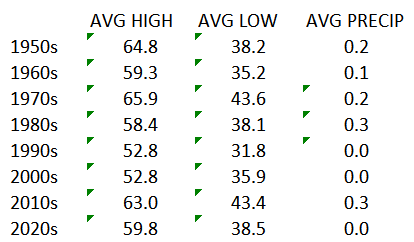
Looking back to 1950, the average Christmas shows 59F for a high temperature and 37F for a low temperature with a 30-percent chance for rain.
But, with our changing climate, taking a longer average like that can be a bit misleading. If we look at data since 2100, for instance, the averages shake out with a high of 62F and a low of 42F with a 25% chance for rain.
Not a big change at all, but subtle.
I will say this, though, taking one day, like Christmas, and saying, well this day used to be like X and now it is like Y, is a bit of an incomplete look.
Because weather can vary on as ingle day pretty wildly. And sure, when looking over a 25 or 75 year period we have plenty of data points to find a trend. But I think looking at the entire week (as I was going above) probably tells a more complete story.
And that trend line since 1950 is pretty flat. Doesn’t mean nothing is happening, but I think it a more complete answer.

And the really cool thing is when you break it out into highs and lows. The afternoon high hasn’t changed much – its up about a degree on the weekly average. But the overnight lows are up nearly three degrees!
That suggests that while the afternoon isn’t getting much warmer, it is staying slightly more mild overnight. And this is a trend we have seen across the region for all seasons – not just the week around Christmas.
The really fun thing is to see how the trends change decadally.
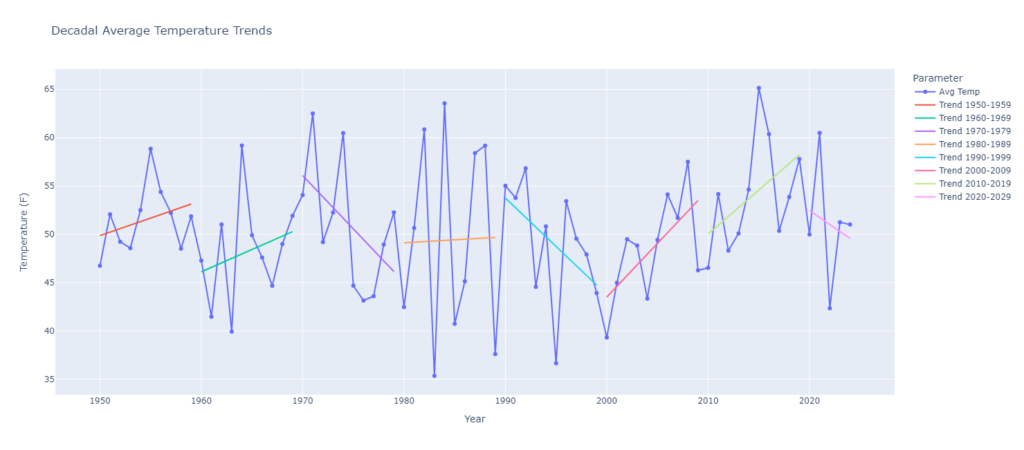
Some of you guys might remember that “global cooling” piece in Time Magazine back in the 70s. Turns out the guys who did the research for that had to redact their findings for a number of reasons, but if they lived in our area, you can see where they may have found their enthusiasm for the paper – the trend in the 70s was cooler for us!
Even the 90s ended cooler than it started. But those are the only two full decades to start warm and end cold. the rest of them start cooler than they end.
Using decadal stuff like this is not a good idea when trying to find a long-term trend, for what its worth. It is “fun” to look at, but, by itself, can’t really explain much of anything when looking at a much longer trend.
The other big takeaway here is that depending on what decade you were born in, it may dictate how you view today’s weather versus when you were a kid.
For example, those born 1970 may think back to being 6 to 15 years old and think, “Man Christmases used to be colder than today!” when in reality, they were simply born in a year when they had, statistically, colder Christmases by coincidence.
Or, if you were born in 1980, you might have the exact opposite take. Where today’s Christmases seem cooler than the ones you had as a kid.
If you were born in 1995, you might think, “Every Christmas seems to be getting warmer than the last!”
All of this is a great example of why we do science and keep records like this. So we don’t have to debate back and forth between people of different ages about “is the weather different today than it was when you were a kid.”
We can simply look at the data!
It probably won’t stop grampa from telling the story about walking uphill in the snow, both ways, to get to school on Christmas Day – after Church – because he didn’t get vacation days like you kids!

THE 2024 FORECAST
That brings us to this year’s forecast! I did include the forecast on those charts. You can see the last dot on all of them is pretty close to “normal” and that is because I think this year looks to be pretty close to normal once you average everything out.
Perhaps slightly cooler than normal, but nothing wild.
But I do think we have a chance for a pretty good temperature swing. Where we have a few days that are pretty cold (which lows below freezing) and a fwe days with temperatures in the 60s and perhaps even pushing 70 degrees.

