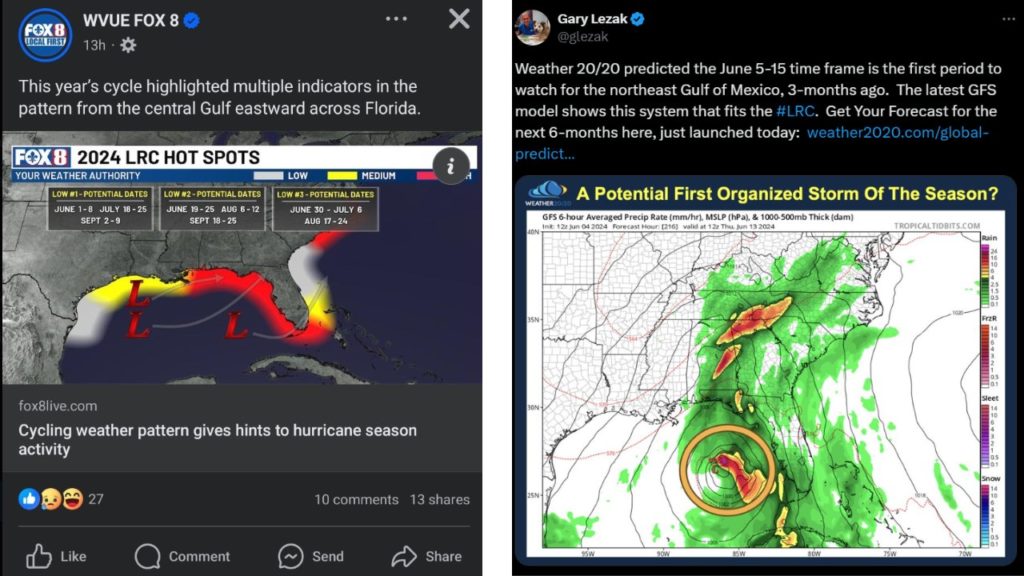
I’m sure some of you guys have seen the graphic on the left from WVUE in New Orleans. It was posted a few days ago highlighting different parts of the Gulf that had chances for tropical system interactions. It gives specific dates.
It is using “the LRC” a cyclic-based forecast derived by Gary Lezak, a meteorologist in the Midwest. It looks at the weather on a set of dates and predict the weather three to six months down the road.

Given all of that, I’m not sure why WVUE waited so long to show the forecast. I mean, if they’ve been sitting on it for three months and if it is so accurate, then why wait until a few days before the first time period where a tropical system is possible to show everyone?
Because it isn’t specifically accurate.
ALWAYS ON GUARD
Forgetting for a moment that the direction – indicated by the arrows – for tropical systems in July, August and September, would not follow the direction shown… the graphic offers a pretty specific-feeling forecast.
The problem is, it isn’t. Neither specific. Nor much a forecast.
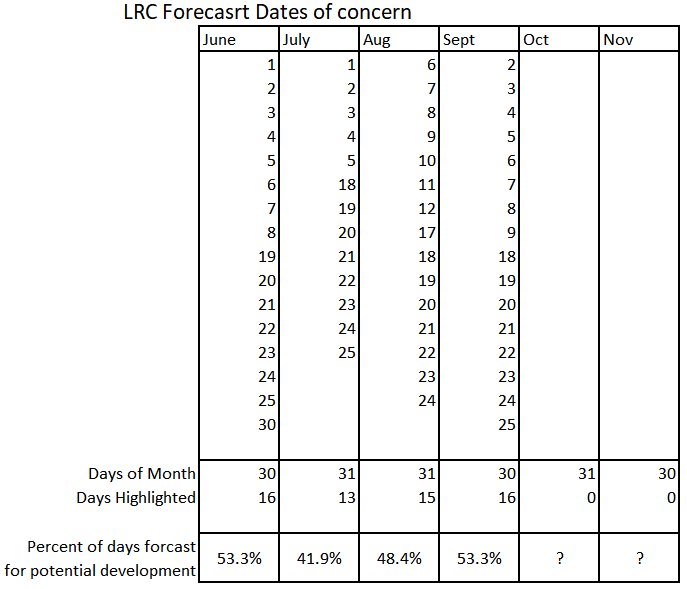
If you stack up all of the days shown in that image, you see that it highlights nearly half of June, half of July, half of August, and half of September as times where tropical development is possible.

Making the forecast, essentially, meaningless.
But now the forecast has changed.
The reason I’m taking such a strong stance on this today is due to the image on the right up there. That image is a screenshot from model guidance from a single run of the GFS model (the model is not terribly accurate at this distance at time, by the way). It was posted by Gary Lezak, using it to cement his claim that the LRC called this development some “3-months ago.”
But the dates the LRC predicted “3 months ago” differ from the forecast offered just a few days ago, based on the same data.
So which is it? And if it s both, then that means the LRC suggests that June 1st through June 25th has a chance for a low in the Gulf.
Again, not much of a forecast.
QUESTIONS
I’m not the only person to ask this question. And the response, from Lezak, is that the cycling can be different depending on user choice.
So the LRC seems like just “the weather cycles, so pick a date, and pick a number between 40 and 100 and then the weather will happen again like it did before”
Perhaps there is more to it, but no one knows. So, from the outside, it looks like anyone can pick any date, and any number of days i the future, and say they are predicting something to happen.
But that isn’t Science.
I like that Gary is an enthusiastic dude. And I commend him for identifying that the weather patterns cycle. And I also appreciate the ingenuity of coming up with a means of prediction based on this cycle. But until it is solidified as one predictive formula and one predictive outcome, it isn’t a meaningful predictor of anything better than climatology is a predictor.
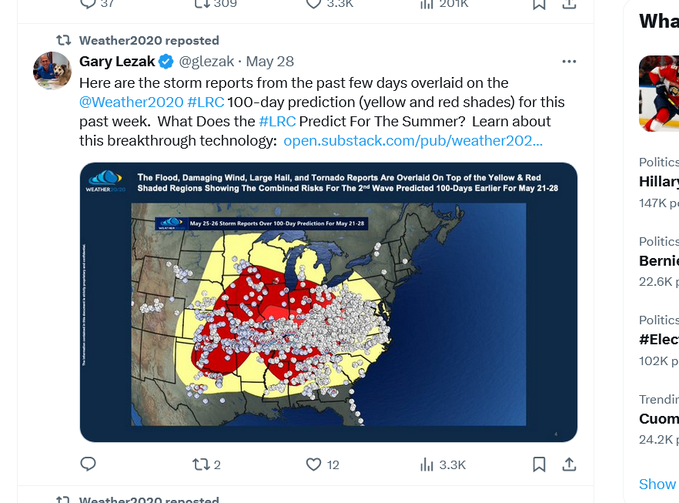
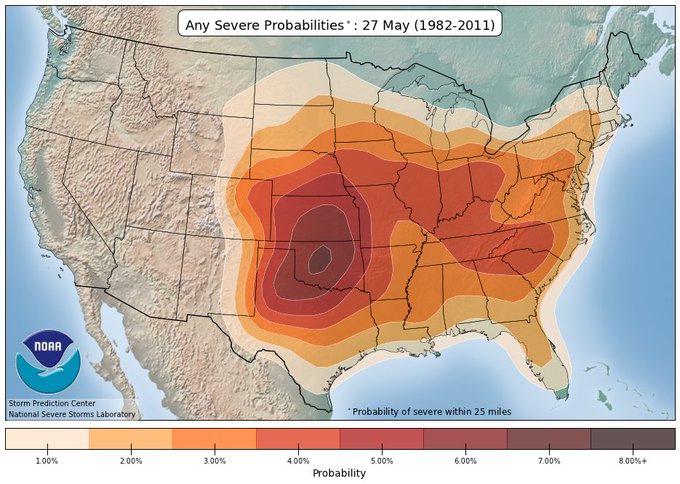
Here is another claim, below and on the left, of the LRC nailing a forecast 100 days out for the period between May 21 and May 28. But below and to the right is the same “forecast” based on climatology.


The maps are basically telling you the same thing. So the LRC forecast isn’t any better than just looking back at 30 years of data and putting it all on a map.
GREAT POWER, GREAT RESPONSIBILITY
Uncle Ben from Spiderman was on to something. That brings me back to what WVUE posted. Because it is misguided at best, and disingenuous at worst. And you – the public – expect your television meteorologists to be smart enough to see through stuff like this.
Because there are folks out there that may be rearranging their family trips, businesses may be rearranging operations, and people with storm anxiety are now sitting, in sweaty anticipation, for random dates to come and pass.
It is the duty of the local meteorologist (myself included) to read as much research as possible, look at the data more than anyone else, and come up with the best prediction possible based on experience, knowledge, and data given the limits of what is scientifically possible given what we know of the atmosphere and the relationships that govern the weather we experience.
Want to use the LRC to “ballpark” things and explain that it is just another tool to give an early heads up for a large region that something, somewhere, may be possible at some point? That’s fine. I don’t know that I would trust it or use it, but I wouldn’t argue against it.
But that isn’t how it is used. It is offered as a Silver Bullet.
Any person willing to ignore the Science of meteorology and offer predictions based on the LRC, without caveats and context, is not worth your time and attention.


Nick, I would like you to email me so we can go over some of the “how” the predictions are done. Your assumptions and conclusions are understandable since you have not yet learned about the LRC. I am inviting you to contact me through my email, let’s set up a zoom, and I will showcase some of the how, why, what, where, and when that the LRC actually answers. One thought on this recent tweet you shared of my showing the GFS and its first prediction of a tropical system this season: The weather pattern is cycling regularly. This next part of the pattern that is favorable for a tropical system to form will cycle through in these next ten days or so. It will return 45 or so days later, and it will return again 45 or so days after that. So, what is 90 days from this timeframe, right during peak hurricane season. There may or may not be any organization in this cycle. If there is, then it increases the probability in the upcoming cycles. If there is not, then the probability is a bit lower in that peak hurricane cycle. I have a 25-page hurricane forecast PDF, not just one seasonal forecast on one page like everyone else. I hope you take up my offer to spend 30 minutes to an hour with me, and I will share information, data, and previous predictions that will likely open your mind to what this really is, which will be worth your time.