Snow lovers and Holiday lovers rejoice! Looking about 10 days out, we are starting to get a better feel for what to expect on Christmas Day! Okay, more on that in a second. Let’s first look at the chances – based on history – that you see a White Christmas.

What does this year show? Well, it doesn’t look like anything out of the ordinary.
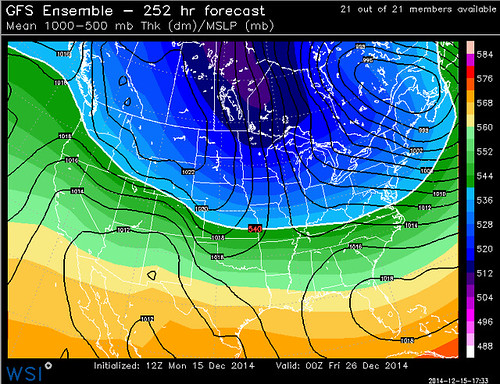
Here is a look at the 12z GFS Ensemble from today for MSLP for Christmas Day. The GFS is a computer weather model and the MSLP is the “Mean Sea Level Pressure.” So on the map we are looking to see how dense the air is in the atmosphere. We can then decide if it is warmer or colder at the surface. Because this map is for air pressure, it isn’t best for figuring out specific temperatures but rather a general warmer or colder map.

Take a look at the lines on the map. Each one has a corresponding number. But there is one line that should stand out. The white line that is designated “540.” Generally speaking if precipitation is going to fall into the area north of that line it will fall as snow and south of the line it will fall as rain.
Now that isn’t a law, but a general rule of thumb. So if you are looking for it to snow on Christmas, you need to be north of that line.
But just because you are north of that line doesn’t guarantee there will be any precipitation falling. So here is a look at the a different version of the same 12z GFS computer weather model. This time it isn’t the Ensemble, but rather just one run of a single model. And – bonus! – the precipitation overlay is turned on:

Take a look at the areas shaded in green. Those areas show where this comptuer weather model thinks precipitation will occur. Also, you can find that same 540 line. Now, you make a general guess that areas shaded in green north of that line could see snow and areas south of that line cloud see rain.
When it comes to forecasting snow/freezing rain/sleet specifically, it can get quite difficult. But this is a good first step.
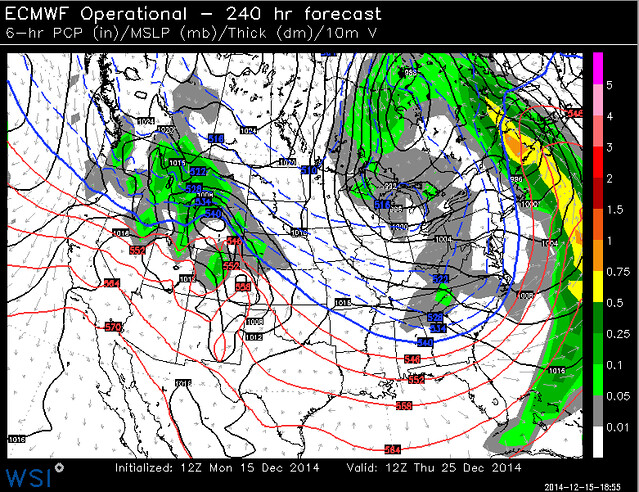
Unfortunately though, forecasting the weather isn’t that easy. One thing to keep in mind is that because we are still 10 days away from Christmas the suggested outcome between weather models is pretty big. The previous model was the GFS. Take a look at what the ECMWF is suggesting for the same exact point in time:

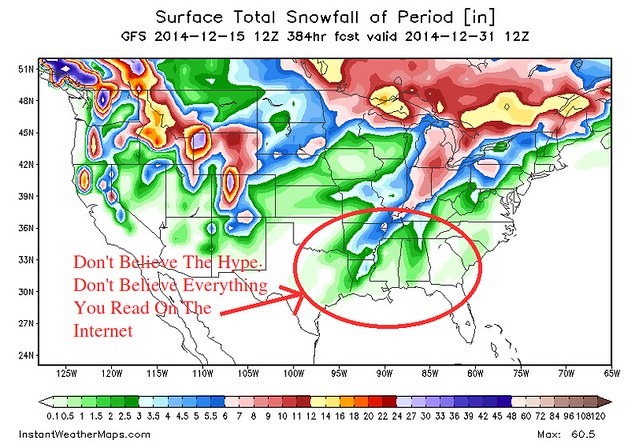
Quite the difference! That is why when you see things floating around the internet that suggest a foot of snow more than one week away, you shouldn’t believe it. Take a look at the same GFS model from above. This is what it suggests for total snowfall between now and New Year’s Day:

The chances that it snows in Houston are astronomically low. It has only snows 35 times in Houston since 1895. The last time it snowed around New Year’s Day was 1995. The last measurabl snowfall was December 4th, 2009.
But, I’m getting ahead of myself. Let’s focus on Christmas!
Again, let’s look at the GFS model. It does show snow depth totals but I don’t necessarily trust it. I think it undershoots actual snow depth sometimes and I think it is doing it today, too. But here is a look at what it suggests for who will have snow on the ground, and how much there will be, on Christmas Day.

The big winners with snow just laying on the ground – as it looks right now – would be Spokane, Casper, Denver, Wichita, Kansas City, St Louis, Chicago, Minneapolis, Detroit, Cleveland, Pittsburgh, and Syracuse.
The good news for you snow lovers, is we are still far enough away that things can change. The bad news is, well, there doesn’t look to be much snow coming for places that don’t usually see a White Christmas.

