Producing the Tropical, CONUS, and Southeast forecast will look a lot like the brief forecast discussion you are doing for the local forecast, just BIGGER. You’ll continue to highlight the mid- and upper-level patterns as well as the potential outcomes at the surface (warmer, cooler, wetter drier), but you’ll be doing it for a much larger area.
And because all of these are interconnected, it will be important that everyone on the team has a chance to chat (even if it is a quick text) with everyone else about the forecast so there aren’t conflicting forecasts on the site.
CONUS
The forecast is going to look out over the next seven days, generally, unless there is something really cool to talk about beyond that. And once we move through the summer, and you learn more about forecasting beyond Day 5 through Day 15 and 20, maybe you could flex those muscles if you wanted.
The first thing to do is look at the big picture up at 500mb. And pick out the main features. You guys have all been doing a great job with this in the local forecasts, so just keep it up for these ‘bigger picture’ forecasts, too.
Write a short paragraph breaking down the bit pieces to monitor.
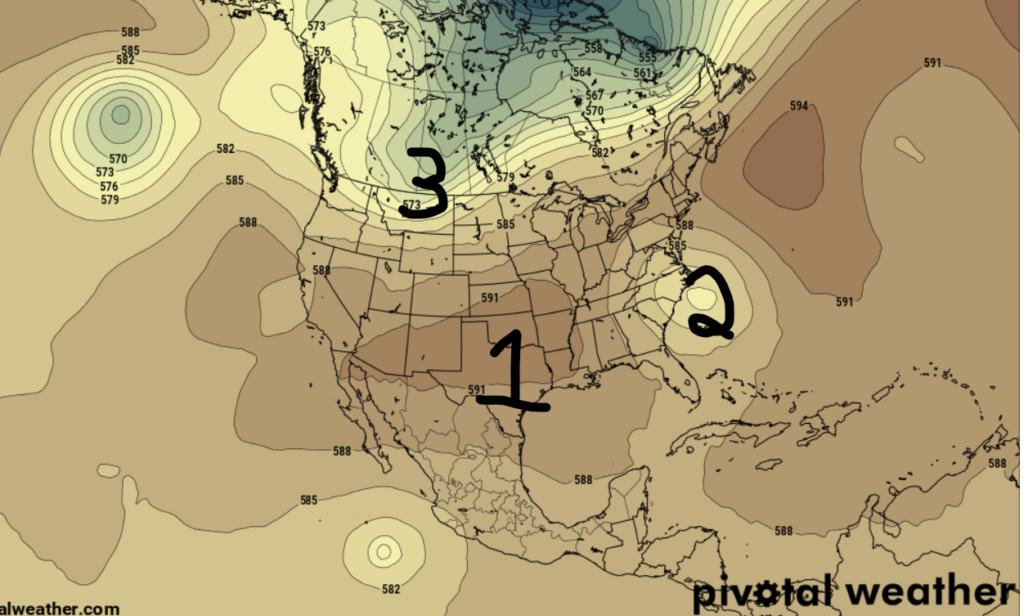
Then pick out three areas to highlight. In an example from today’s model data, you might pick out the heat in the south, the potential area of low pressure of the east coast, and the next front in the Great Lakes.

From there, spend about a paragraph or two talking about each. And use a graphic to help explain what you are highlighting.
For example, you may use an 850mb anomaly map to talk about just how hot it will be in the south. Then you could use a 500mb anomaly map to talk about the riff-raff of the east coast (or an animated GIF to show the potential development). And then you could show an estimated reflectivity or 6hr rainfall map to show the front nearing the Great Lakes.
And, like I mentioned, you would then write a paragraph (or two) about what the general pattern was going to be for those areas.
I’ll do a quick one for the front entering the Great Lakes:
Get ready to bake for the next week. We will see one weaker front swing through around Wednesday/Thursday of this week, but it will only offer a brief shot of ‘normal’ for the area. Then, temperatures will eventually fall back closer to average across the Great Lakes as a front swings through the area around Sunday/Monday of next week. That front may pack a bit more of a punch with the chance for showers and storms. As of now, guidance isn’t showing much int eh development of robust storms like last week, but it will need to be monitored in subsequent model runs.
So you would do one of those for each of the three areas you picked out. Some days you may only have two areas worth mentioning – that is fine. But most times there will be three spots worth picking out.
Pretty easy and straight-forward. Just giving people a good overview of the weather for the next few days across the US. If you want to see what the WPC is saying about the pattern you can head over here: https://www.nickelblock.com/detailed-national-forecast-discussion/
SOUTHEAST
Producing these Southeast forecasts will require some collaboration with the person who is producing the CONUS forecast. Because we can’t have conflicting forecasts on the same site. So make sure when you are producing this forecast that you have a chat (even if it is brief) with teh person who is doing the CONUS forecast to make sure everyone is on the same page.
This will just be a three-day forecast. Mainly for folks that are traveling for work or taking the family on a trip.
For the Southeast, you will do the same as your local forecast with a brief overview of the mid-and upper-level pattern. But instead of a Day-to-Day forecast, you’ll produce a “Three-day forecast” for the major hubs. Just highs/lows and chance for rain.
The list for cities is…..
Dallas
Houston
New Orleans
Little Rock
Memphis
Birmingham
Atlanta
And you can choose to produce the high/low forecast on your own (which may be faster, once you get used to doing it) or you can use the NWS forecasts for high/low and precip for each city.
And you’ll want to use the “Table” function (hit the plus sign, like when adding an image, but search for “table”) to do the forecasts. Fore each city, the table will be three (3) columns and five (5) rows. And it should look like this:
| Dallas | ||
| Monday | Tuesday | Wednesday |
| High: 95 | High: 96 | High: 98 |
| Low: 75 | Low: 73 | Low: 74 |
| Precip: None | Precip: None | Precip: None |
And you’ll build this post just like the other local posts with the discussion above and the “three-day forecast” below.
TROPICS
The Tropical outlook is going to probably take the most time to produce. Particularly when there is a lot going on. This will be a look at the next seven days.
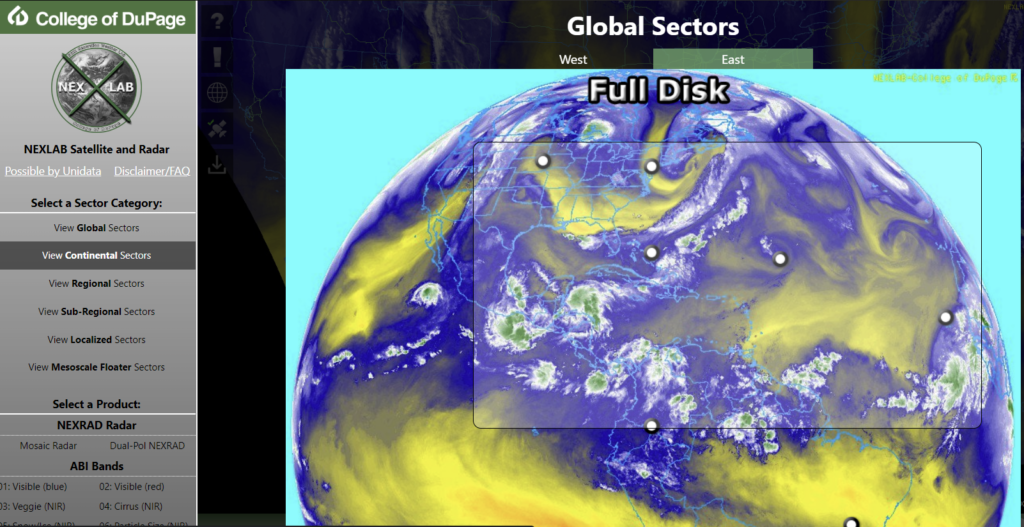
I always try to start the post with a screenshot of the entire basin from the College of DuPage GOES16 mid-level water vapor imagery map. and just do a casual hand-analysis of where the features on the map are located.
If you’ve never used COD GOES16 maps, you can find them here: https://weather.cod.edu/satrad/?parms=continental-southconus-09-48-0-100-1&checked=usint-map&colorbar=undefined

Select the Atlantic basin box (shown above).
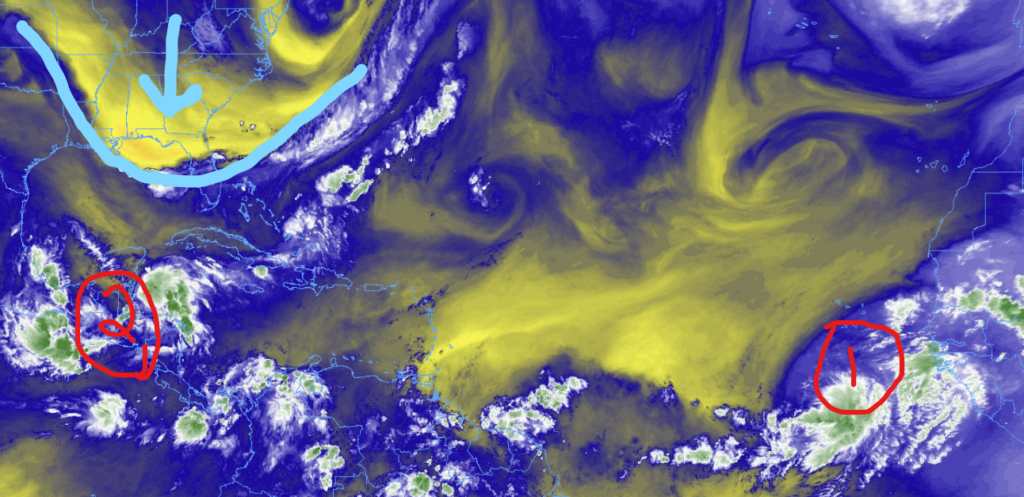
The casual hand-drawn analysis may look like the map below. Just highlight the areas worth mentioning and then draw in features like fronts, shear and TUTT lows (I’ll explain TUTT lows later, if you are less familiar)

After posting the image, just give a quick few sentences on what you see. In this case I would say, “Mid-level dry air is pushing south toward the Gulf across the south while two areas of interest are out in the Atlantic. One near Central America and the other coming off the coast of Africa” nothing too fancy.
Then, I would look into the quasi-top-down look at the overall Atlantic basin. Start with the 500mb highs and lows, then look at the 300mb shear, then look at the 700mb moisture (relative humidity is fine), then the 850mb vorticity, then dive down and find the tropical waves.
That’s a lot, I know. But you don’t have to write about all of that. You just have to look at it all to get an idea about what will happen during the next seven days.
Then your discussion will feature how things will progress and where features will be moving during that time period. I have two rules I live by with tropical discussions: (1) post lots of maps and graphics and (2) explain every map and graphic I post with at least two sentences of context to help readers follow along. without getting too confused.
And when there are actual tropical systems / invests out there you will also have to post the spaghettis and model intensity estimates.
It’s a lot. But I love writing them and I think you’ll actually enjoy them, too. Because you get to dive deep into the weeds

