Thank you for taking the time to read my third research paper of the summer! Today we’re going to be focusing on tall towers and how they can give us data to help forecast weather events such as tropical systems. I ended up pulling data from three hurricanes to give different examples of how we can break down the given information.
Some factors I will be looking at include specific atmospheric conditions, such as wind speed and direction. Additionally, it was crucial to find the height of the anemometer, the barometer elevation, and the time resolution of the tall tower. The goal is to use the data provided to improve short-term forecasting and show that the numbers make sense with each of the case studies provided.
Background
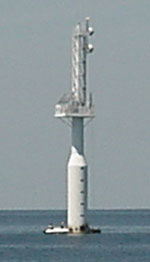
The purpose of these towers is to pick up measurements such as temperature, wind speed, pressure, water level, humidity, and more every couple of minutes to present the newest data available to the public.

Over the past decade, tall towers have been introduced to many parts of the United States, including the Gulf of Mexico. We must use this data in order to find new information about the weather that is affecting people daily. Using tall tower data for hurricane data is an effective way to show the severity of the storm and allow people to make the necessary precautions.
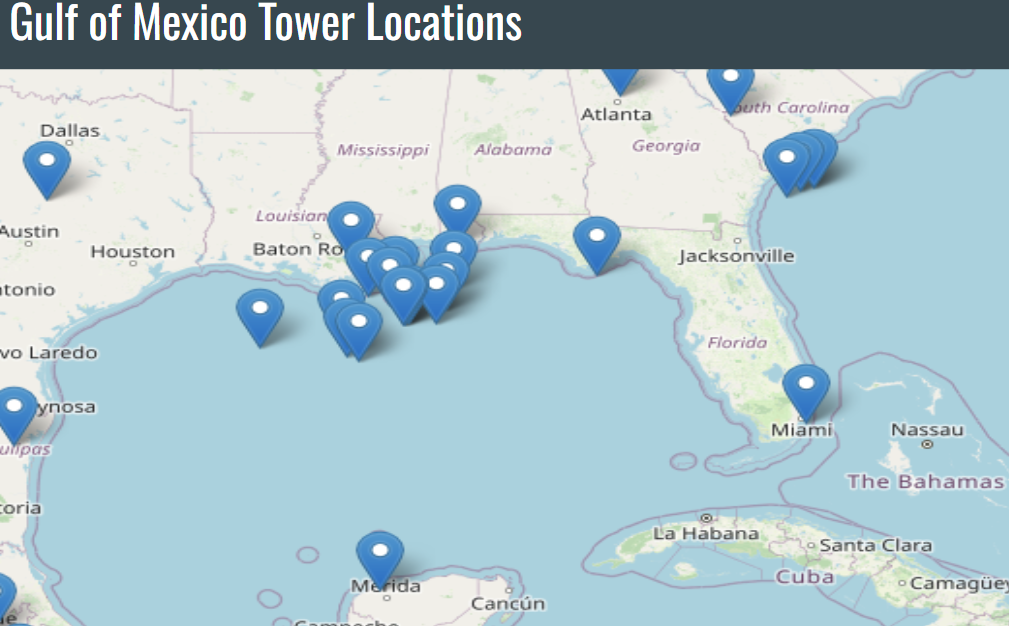
Unfortunately, these tall towers are not everywhere in the Gulf of Mexico, so we have to rely on buoy data which is cheaper and not as effective. Today I will show you how helpful it is to have fast and available data with examples from three past hurricanes that caused extensive damage to the United States coastline.
Example 1: Hurricane Sally
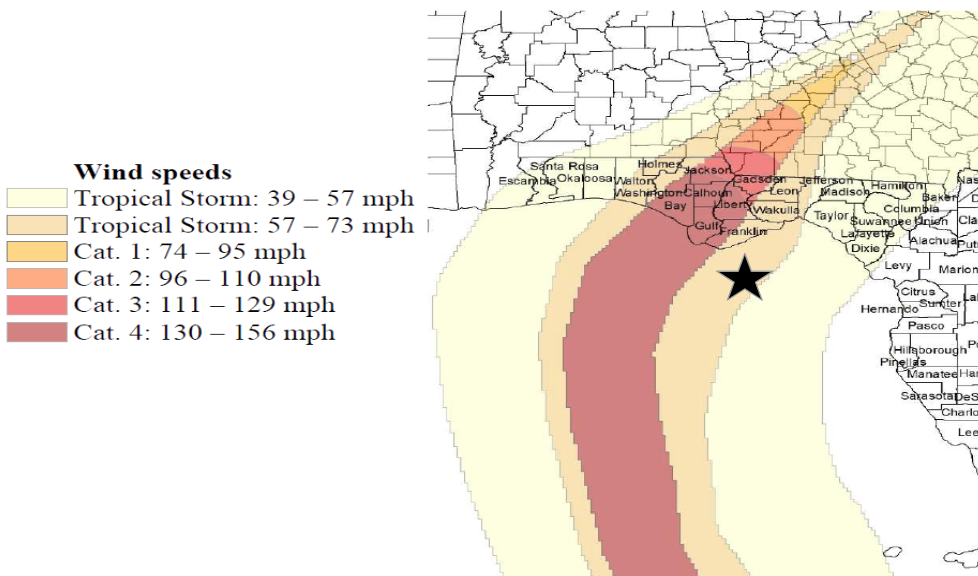
The first tall tower I researched was located around thirty miles offshore of Apalachicola, FL. This site featured an anemometer height of thirty-five meters, so wind measurements would be slightly higher than at the surface. Time resolution is key when assessing tall tower data to find out how often observations are being made available to everyone. With this specific location, the resolution was every sixty minutes which isn’t the best, but for a storm like a hurricane, it will work due to its slow forward speed.
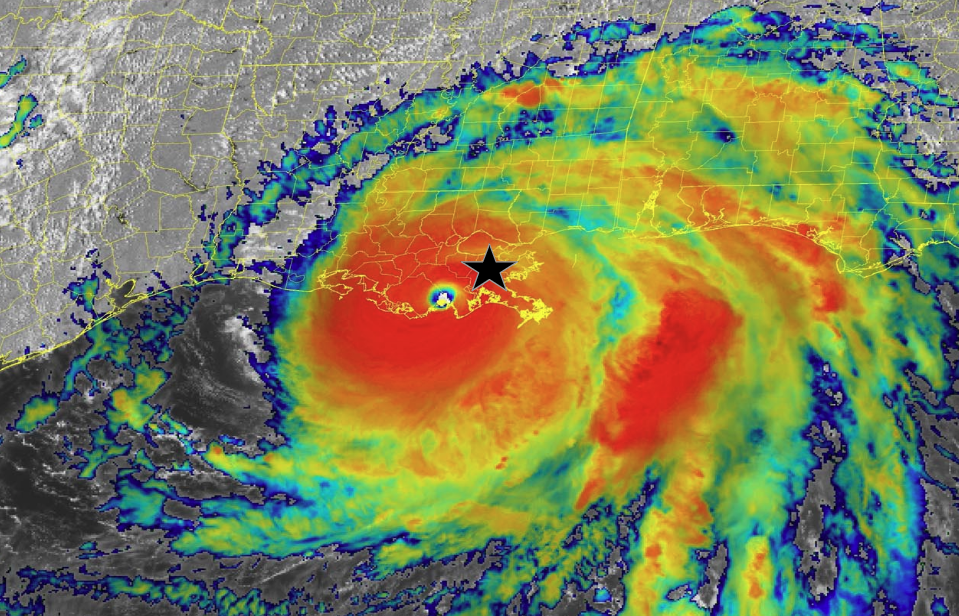
The storm that showed the best data for this tower station was Hurricane Michael which made landfall in Mexico Beach, FL on the afternoon of October 10th, 2018. Michael was the first category 5 hurricane to hit the contiguous United States since Andrew in 1992. The top wind speeds during the 2018 hurricane were around 160 mph during landfall, and life-changing damage took place over the Florida peninsula.
With the tower location around fifty to seventy-five miles east of the center of circulation, wind observations were likely not going to be significant. As the major hurricane approached the Florida panhandle the morning of October 18th, wind observations were being reported out of the south-southeast which makes sense synoptically as the storm is west of the tall tower spinning counter-
clockwise.
With landfall taking place at 12:30 PM CDT, I tried to focus on observations right before then. At 11:00 AM CDT, sustained wind speeds were measured at seventy miles per hour with gusts around a hundred miles per hour. Stronger wind speeds on the eastern side of the eyewall allowed for catastrophic storm surge to flood northward.
Example 2: Hurricane Michael
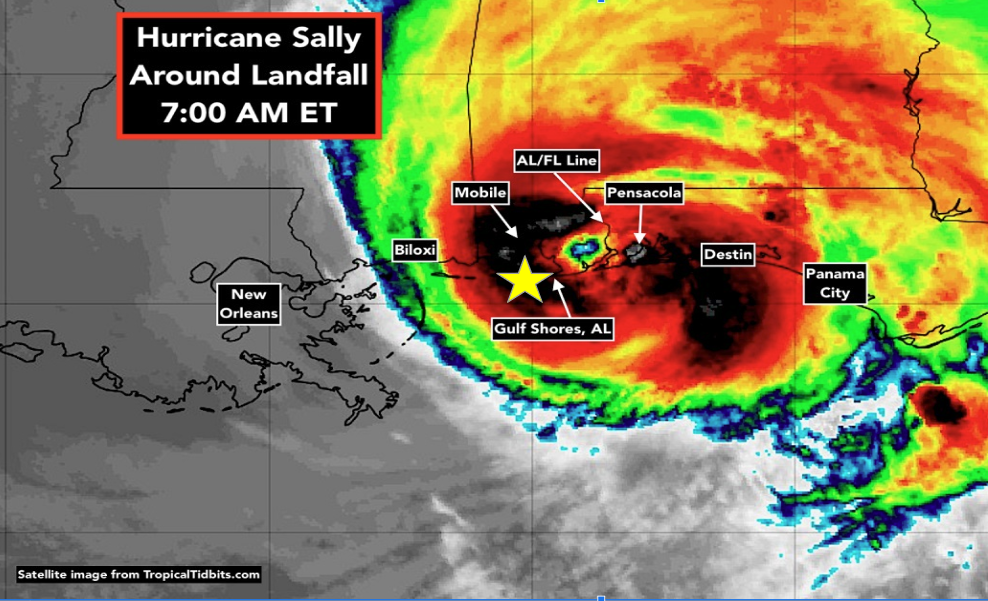
Another significant hurricane that impacted the Gulf Coast was Hurricane Sally back in 2020 as this storm had a different issue compared to Michael. Widespread flooding took place across southern Alabama and western Florida with some locations exceeding twenty inches of rainfall.
The location of the second tall tower was only a few miles offshore of Fort Morgan, AL which provided very interesting results. Even though this hurricane was a lot weaker compared to Michael, the direct path of the storm moved closer to the observation tower, so the results were close to the official data coming in from the National Hurricane Center. The barometer elevation was similar to the other tower at 36.2 meters above sea level, so wind speeds would be a little weaker at the surface. The good news about this station was that the time resolution was every ten minutes, so there was a lot more data to choose from.
After landfall, the hurricane slowly moved westward towards the tall tower and at 10:24 AM CDT, it observed a pressure of 978.1 mb with sustained winds measured at 98 mph out of the north-northwest. This would make sense because the eye wall is just off to the west of Fort Morgan at this time. Also, storm surge wasn’t as big of an issue across southwest Alabama due to the northerly winds blowing the water away from the coastline. The main storyline from Sally was the deadly flash flooding that took place as the hurricane sat near the coastline for hours dumping torrential rainfall.
Example 3: Hurricane Ida
The final hurricane looked at with tall tower data was hurricane Ida which made landfall near New Orleans, LA on August 29th, 2021 at 11:55 AM CST. This storm is another “I” named tropical system to cause severe damage in the United States as Ida rapidly intensified over the Gulf of Mexico with sea surface temperatures around 90 degrees Fahrenheit.
This was the only tall tower out of the three to be built inland a few miles, so wind speeds would likely be lower since hurricanes begin to weaken as they push further inland. All three of the tall towers had an anemometer height of around thirty to thirty-five meters, so based on this, meteorologists want to keep all of them nearly the same to avoid errors in their calculations and forecasts. Similar to the Fort Morgan station, New Orleans has a time resolution of ten-minute intervals that can be helpful during tornado season as well.
When Ida intensified right up to landfall, New Orleans was sitting on the eastern side of the storm which is not good when it comes to storm surge potential. At 12:30 PM CST, the tall tower dataset recorded sustained winds of sixty-four miles per hour with gusts up to ninety-five miles per hour. Even though the winds were weaker compared to the other two stations, the storm surge was still a massive issue with southeast winds pummeling the Louisiana coastline for hours.
Conclusion
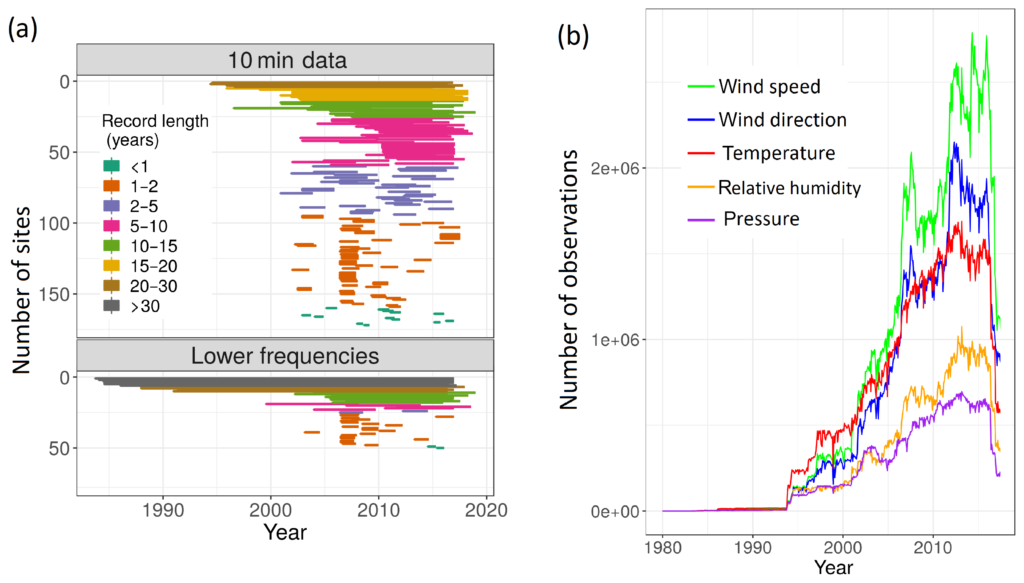
In summation, tall tower datasets took off after the 1990s and became available to many locations across the United States. Getting valuable information to help forecast events from blizzards to tornadoes is key to allow the public to prepare and stay safe. Unfortunately, constructing meteorological tall towers costs millions of dollars which is one of many setbacks with this idea. Especially, with hurricanes, it can be tricky to find places to build these along the Gulf Coast and the difficulty it would be to access them to repair and maintain.
Tall tower datasets should be used more in the future and meteorologists need to educate people on how they can access this information because this website was new to me. After looking at all of the different products they offer, I feel more confident in explaining the weather to those around me. This idea is important with any weather going on, but especially with something as
devastating as a hurricane. Thank you again for reading this review!
Sources
Barker, Aaron. “Hurricane Ida: A Look Back at the Monstrous Storm That Killed over 50
People.” FOX Weather, Fox Weather, 26 Aug. 2022, www.foxweather.com/extreme-
weather/hurricane-ida-one-year. Accessed 31 July 2024.
Berg, Robbie, and Brad J Reinhart . Hurricane Sally, 14 Apr. 2021,
www.nhc.noaa.gov/data/tcr/AL192020_Sally.pdf. Accessed 01 August 2024.
Ramon, J., Lledó, L., Pérez-Zanón, N., Soret, A., and Doblas-Reyes, F. J.: The Tall Tower
Dataset: a unique initiative to boost wind energy research, Earth Syst. Sci. Data, 12,
429–439, https://doi.org/10.5194/essd-12-429-2020, 2020.
“The Tall Tower Dataset.” Home, talltowers.bsc.es/access-the-data. Accessed 30 July. 2024.
The Weather Channel. “Hurricane Michael Recap: Historic Category 5 Florida Panhandle
Landfall and Inland Wind Damage Swath.” The Weather Channel, 21 Sept. 2023,
weather.com/storms/hurricane/news/2018-10-11-hurricane-michael-recap-gulf-coast-
southeast. Accessed 01 August 2024.


