It’s here.
As we kick off the 2024 Atlantic Hurricane Season, there are several key factors and trends that suggest we might be in for an active season. Here’s a breakdown of what to expect based on current observations and historical data.
WARM WATERS
The Atlantic Ocean, including the Gulf of Mexico, is experiencing very warm temperatures. In some parts of the Atlantic we are already as warm – or warmer – than we would be at the peak of any past Hurricane Season (August/September) and it is only June 1st. These warm waters are significant because they provide the energy needed for hurricane development. Historically, the Gulf of Mexico’s temperatures are near record highs, with a noticeable warming trend during May.
Comparing current conditions to previous years, such as 2010, shows that while similar warmth was observed, the forecast this year does not predict a cooling trend through the summer like we saw in the Atlantic during the 2010 season. This persistent warmth sets the stage for potential storm development throughout the season.
FORECASTING THE SEASON
Using a combination of historical analog guidance and current meteorological data, we can estimate the activity for this hurricane season. Key factors considered include sea surface temperatures, wind patterns at different atmospheric levels, and overall atmospheric stability. These factors show a strong correlation between early-year conditions and summer weather patterns, influencing storm development.
What the Numbers Say
Our forecast predicts a robust hurricane season:
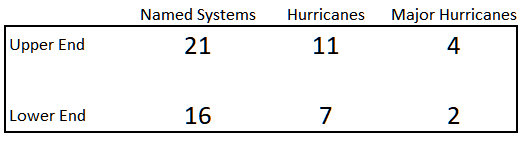
This forecast is based on
To forecast the upcoming hurricane season, we rely heavily on historical data, or “analog guidance.” This approach is based on the principle that past patterns can help predict future events, a method widely used in atmospheric science.
For this analysis, we looked at several key parameters:
- Sea Surface Temperatures (SST)
- El Niño-Southern Oscillation (ENSO)
- Wind patterns and atmospheric heights at various levels (250mb, 500mb, 850mb, and 1000mb)
- Relative humidity at 700mb
We compared these parameters from January through April to those from June through September to identify correlations. These correlations help us understand how early-year conditions might influence summer weather patterns and tropical storm development.
Our findings showed that many parameters, such as SST and geopotential heights at different levels, had significant correlations between the two periods. For example:
- SST showed a correlation of 0.69
- 500mb Geopotential Heights showed a correlation of 0.73
Using these correlations, we can estimate summer conditions and their potential to foster tropical storms. We applied trend line equations from the charts to predict June through September temperatures and their impact on storm development.

For a complete breakdown of the forecast and all of the numbers, charts, graphics and details… Head HERE.
PREPAREDNESS IS PARAMOUNT
While this forecast is based on the best available data, it’s important to stay prepared and updated as the season progresses. Conditions can change, and new data in May and June will provide a clearer picture. Stay tuned for updates and make sure your hurricane preparedness plans are in place.


