Hopefully, this works. It should. But, in weather, nothing is perfect.
Words I muttered to myself as I sat down at my Ubuntu Linux computer and opened up LibreOffice Calc. In an effort to solve the equation of Karrie Leggit-Brown’s severe weather anxiety, I decided find which atmospheric parameters lined up with giving an area the best chance to see severe weather and also could be thrown into a pot and spit out on a 1 to XX scale that would be understandable by a non-meteorologist. This parameter would also need to be useful everywhere in the country – not just south Mississippi – in case Karrie decided to go on a trip.
I came up with something simple. A unitless number.
Karrie’s Anxiety = Surface Dewpoint (C) + Helicity + ML CAPE + (3k shear + 6k Shear) + (Absolute Value of 850mb Temp (C) – 500mb Temp (C))
Again, we’re going to drop the units. But, in order to make this useful, let’s find out what that equation gives you:
Karries’ Anxiety = 13 + 200 + 1200 + 80 + 20 = 1513
What does 1513 even mean? And leaving it as-is means that CAPE is a big piece of a puzzle for no other reason than the parameter is just a bigger number when originally calculated. That leaves us with something even more meaningless than when we started. I had to give Karrie’s Anxiety some comparison. A number doesn’t mean anything unless it can be compared against another number.
So, I looked back through local climatology and the SPC Tornado Database page. And I compared each number from the models against historical averages.
Karrie’s Anxiety = (Surface Dewpoint / Historical Average) + (Helicity / Historical Average) + (ML CAPE / Historical Average) + ((3k shear + 6k Shear) / Historical Average)+ ((Absolute Value of 850mb Temp – 500mb Temp) / Historical Average)
And this makes sense. Both mathematically and psychologically.
Mathematically, you want to compare current data against past data to see if the current data will present the opportunity for severe weather. If severe weather happened in the past under similar conditions, it is likely to happen again. Tehre is plenty of research to show this. A big (and easy) one to find is the CIPS Analog Guidance page.
Psychologically, Pavlov’s Dog proved that responding to feedback is a real thing. In this case, the feedback isn’t a bell and a treat but a number and a tornado.
So, how does it breakdown for south Mississippi? Here are the climatological averages for the parameters (that produced severe weather) used:
Surface Dewpoint = 13 (From reanalysis of past local events forecast)
Helicity = 250 (From the Tornado Environment Browser)
CAPE = 600 (From the Tornado Environment Browser)
3k + 6k Shear = 80 (From the Tornado Environment Browser)
Absolute Value of 850mb Temp – 500mb Temp = 20 (From reanalysis of past local events forecast)
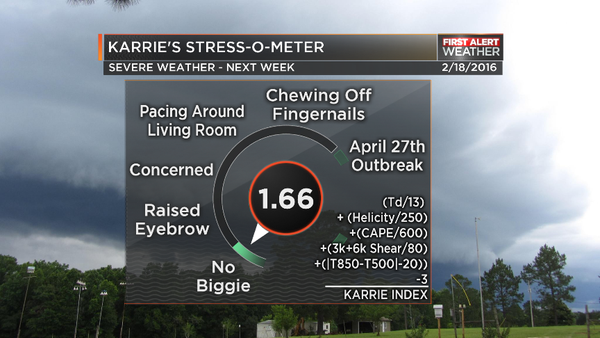
Now, there is a number that can be derived to quantify the level of anxiety felt by Karrie. The next chance for thunderstorms across the area gives us a chance to use this new equation:
Karrie’s Anxiety = (Surface Dewpoint / Historical Average) + (Helicity / Historical Average) + (ML CAPE / Historical Average) + ((3k shear + 6k Shear) / Historical Average)+ ((Absolute Value of 850mb Temp – 500mb Temp) / Historical Average)
Karrie’s Anxiety = (8/13)+(275/250)+(700/600)+(35+50)/80)+((|9-(-19)|/20) = 5.81
A forecast of 5.81 can now be put into relative perspective. Don’t forget that because this is basic addition there won’t be a time when the number is zero. And there will be times when Karrie’s Anxiety is actually zero. For south Mississippi – and likely other places, too, but I didn’t do the math here – it has been found that any number under 3 is statistically insignificant for severe weather. The scale can be adjusted accordingly.
Karrie’s Anxiety (for the next severe weather event) = (8/13)+(275/250)+(700/600)+(35+50)/80)+((|9-(-19)|/20) = 5.81 -> KA = 5.81 – 3 = 2.81
Now, without a scale, that seems like an arbitrary number. So we have to give it boundaries. Doing the same calculation for the April 27, 2011 outbreak (where many tornadoes ripped across parts of the Southeast, including the terrible tornado that moved through Tuscaloosa) a number of 10.5 is derived. So, one could argue that 10.5 is a devastatingly bad day. Full of high anxiety. The last severe event – during an Enhanced Risk – where an EF-2 tornado moved through the area just to our north, the derived number was a 5.12.
The double interesting thing here is – if divided in half to match the five-tier scale from the SPC – the scale almost lines up with the SPC outlooks
April 27, 2011 = 10.5 -> divided in half 5.25 -> High Risk
Last event = 5.12 -> divided in half = 2.56 -> Between Slight and Enhanced
Next event = 2.81 -> divided in half = 1.405 -> Marginal Risk?
This is only three examples, but it is a neat coincidence. And, perhaps, says the SPC did a good job when figuring out their threat levels.
And a reminder, this same calculation can be used for any area. Simply replace the historical averages use here with ones for any local area’s climatological averages.


