2022 UPDATE:
I’ve added the video below from the 15 year anniversary of Hurricane Katrina to add extra evidence tot eh proverbial ‘pile’ of data.
2017 ORIGINAL:
It is something I’ve heard countless times during my tenure at WDAM in Hattiesburg. It doesn’t matter the time of year, the forecast, or the situation. For every forecast I give, there is – at least – one person that responds with, “Yeah, well, they didn’t get Katrina right, so who knows.”
I’ll call this the “Katrina Response” for the rest of this piece. And for what it is worth, the “rules” that dictate where tropical storms move are the same “rules” like Gravity, Thermodynamics, and Coriolis. But that is for another day.
There are a handful of reasons people respond that way. Some feel slighted by a perceived bad forecast. Some just want to be snarky. Some lived through it, and worry about a similar situation occurring again.
A quick aside: If you are skeptical of forecasts due to Severe Weather Anxiety or due to Post-Traumatic Stress Disorder from living through the events like Katrina, I know that every storm stirs up emotions and fears. And I can’t imagine how difficult that is to wrestle with. I hope this helps – even just a tiny bit! – ease those fears and calm those emotions the next time a tropical system develops. This is aimed at helping everyone understand and delineate fact from fiction. And history from folklore.
The Katrina Response, though, can be troublesome for forecasters on two ends. First, the easy one, claiming it was a “bad forecast” isn’t necessarily accurate. Second, that claim is undermining the legitimacy of current forecasts that some people need to take seriously.

As of the time of this writing, Hurricane Irma is most likely going to bring life-threatening wind, rain, storm surge, and tornadoes to Florida but the retort some meteorologists have received during the past few days from some people is that, well, how could meteorologists even know?
Because Katrina.
This can cause the people who need to act to hesitate. Or it can cause those who don’t need to do anything, to do something.
I witnessed a lot of this in Hattiesburg. When Irma was east of the Leeward Islands, people were already stocking up on extra supplies because “Katrina came out of nowhere” and was “poorly forecast” and they wanted to stock up for when meteorologists were wrong again. And I’m not talking about buying some extra water or canned food. People were filling up multiple gas cans, buying second generators, and purchasing hundreds-and-hundreds of dollars of food.
Meanwhile, others in Florida were unfazed. They cited the same storm but different reasoning. Saying, “well they didn’t get Katrina right, it will probably miss us”
And that can create a problem.
The boom of population growth along the Gulf Coast and in Florida since 2005 has been incredible. There are people living in hurricane-prone areas that didn’t live through Katrina. Or have never lived through any tropical system. Those new people can hear the “Katrina Response,” take it to heart, and disregard legitimate alerts to potential threats. Or do nothing when it is time to act.
Meaning they react when no reaction may have been necessary. Or vice-versa.
So, I want to take some time to walk through the whole Hurricane Katrina forecast – as the forecast itself wasn’t bad. It wasn’t great, but it was not inaccurate. It may have been misrepresented or misunderstood. But neither of which delegitimizes the forecast at the time. Nor any forecast today.
No one wants to be wrong
For those reading this that don’t have strong opinions on the forecast for Hurricane Katrina, this whole thing may sound a bit funny. A lot of people in the country have built up this “Katrina was a bad forecast” thing over the years. It holds deep – nearly religious – feelings for some.
The response above is not an uncommon one.
Neither is the follow up I get once showing people the forecast.
Often, like the two above examples, even the evidence offered to counter my comments, supports my stance that Katrina had a decent forecast track. And yet, people still disagree. In fact, I’ve found that trying to explain the decency of the Katrina forecast tends to do one of a few things:
- My explanations are ignored in favor of established beliefs
- I cause frustration
- My evidence will illicit a “you weren’t here” response
And that is strange to a scientist.
For a scientist, we look at the new facts – ones that may be different from old facts – and accept those new facts as the facts if are backed up by more evidence. If so, well, the new facts are more accurate than the old facts. So, it is time to accept the new facts as the facts.
But that isn’t how it works with Katrina. It must be approached from the angle of challenging personal beliefs. Challenging someone’s beliefs is often going to get a similar reaction to the one above. I suppose, for some folks that believe it was an inaccurate forecast, challenging that would make them feel as though they were wrong. And no one wants that. So they defend their stance.
According to behavioral science and psychology that reaction is natural. But my goal here is to help people, even those adamant about the poor forecasting of Katrina, open their mind for the next few minutes: I’m really trying to help everyone rest a bit easier at night.
Understanding The Cone
Alleviating this problem in the future, I think, involves education about the Forecast Cone. The Cone of Uncertainty is something that is now pretty well-understood by people along the Gulf Coast and East Coast. Maybe not the math behind it, but people can eyeball it and understand what to expect.
The weather community has done a pretty good job during the last 10 to 20 years to make that part of the weather lexicon. Most people along the Gulf Coast understand the Forecast Cone these days. Even though, we don’t have a James-Spann-like to “Heed the Cone” or something similar – people have really come around and get it.
And that is awesome.
For those who haven’t had the “Weather 101: The Cone of Uncertainty” class here is the definition from the National Hurricane Center:
The cone represents the probable track of the center of a tropical cyclone, and is formed by enclosing the area swept out by a set of circles along the forecast track (at 12, 24, 36 hours, etc). The size of each circle is set so that two-thirds of historical official forecast errors over a 5-year sample fall within the circle.
One can also examine historical tracks to determine how often the entire 5-day path of a cyclone remains completely within the area of the cone. This is a different perspective that ignores most timing errors. For example, a storm moving very slowly but in the expected direction would still be within the area of the cone, even though the track forecast error could be very large. Based on forecasts over the previous 5 years, the entire track of the tropical cyclone can be expected to remain within the cone roughly 60-70% of the time.
Forecast Period
(hours)2/3 Probability Circle,
Atlantic Basin
(nautical miles)2/3 Probability Circle,
Eastern North Pacific Basin
(nautical miles)12 29 25 24 45 40 36 63 51 48 78 66 72 107 93 96 159 116 120 211 151
That is why it is a cone and not just a line.
The NHC understands that tropical cyclones (be it Tropical Depressions, Tropical Storms, or Hurricanes) don’t go in a straight line, tend to not follow model guidance perfectly, and can be influenced by other atmospheric interactions. That means that today, five days out, the possible accountable error is up to 211 miles. In 2005, it was even higher.
The comparison between Hurricane Katrina’s cone then and now:

That may seem like a lot, but if you think about the area of a circle, that means that if you pick a point in the center, it will be within 105.5 miles of the center point.
The Forecast
The number one thing I hear from people is that Katrina was supposed to do one thing, but then did a different thing – that no one saw coming – and hit the Gulf Coast of Louisiana and Mississippi. It gave folks very little time to react.
The problem is, that isn’t entirely true.
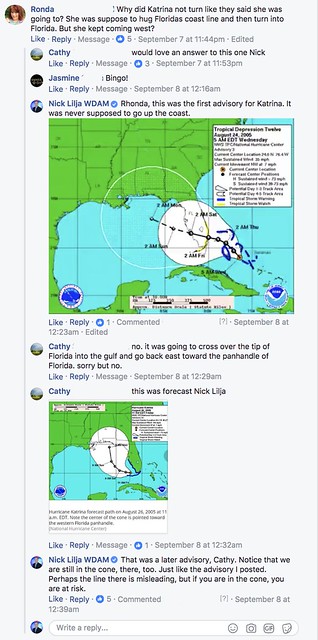
The National Hurricane Center saw it as a possibility. And told everyone. Five days ahead of time.

The forecast cone from Wednesday at 5am on Wednesday August 24 showed New Orleans, Biloxi, Mobile and Tallahassee in the Day Five forecast cone. Meaning that the National Hurricane Center thought it was possible for it to be in or around any of those places in five days.
As the forecast was massaged and new data came in the forecast cone shifted. But the same cities remained in the cone. This time in the Day Three cone.

You may think, “but look at the line! It is headed toward Florida!” but the line isn’t the thing to follow. The cone itself is.
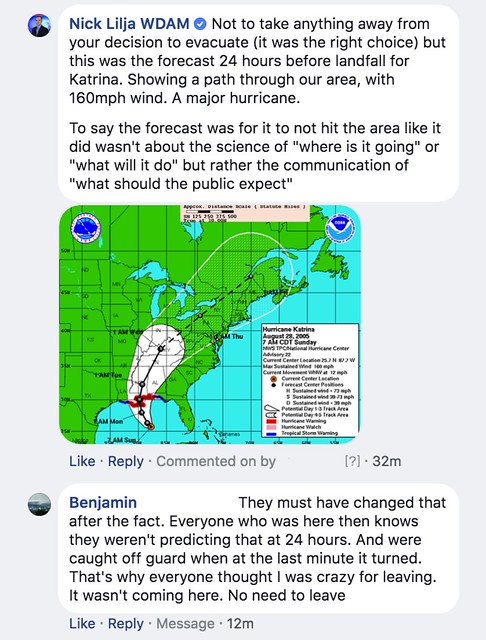
Even later, when most people agree that the forecast called for Katrina to hit Mississippi and Louisiana, some of the same cities – New Orleans, Biloxi, Mobile – were still in the cone.

From the time it formed as a Tropical Depression until it ran ashore the landfall point was in – or very near – the cone. It was also within the “fence” of model data. Meaning model data suggested a track to the west AND to the east of the landfall point at every six hour update.
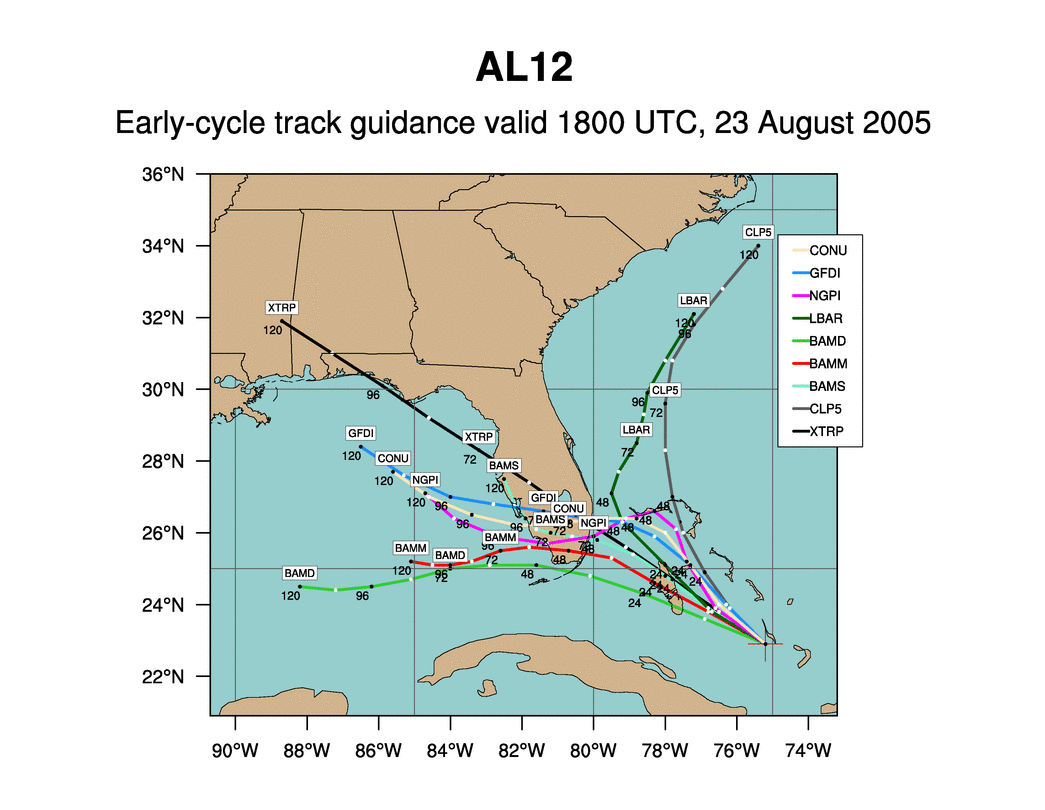
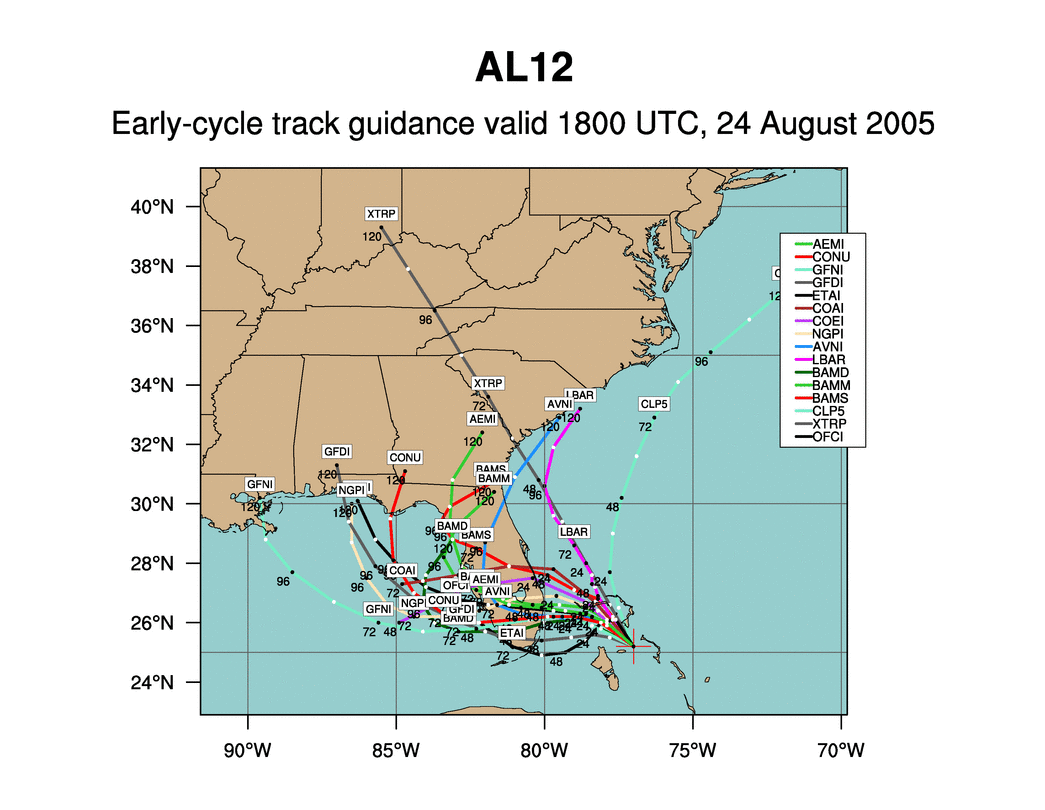
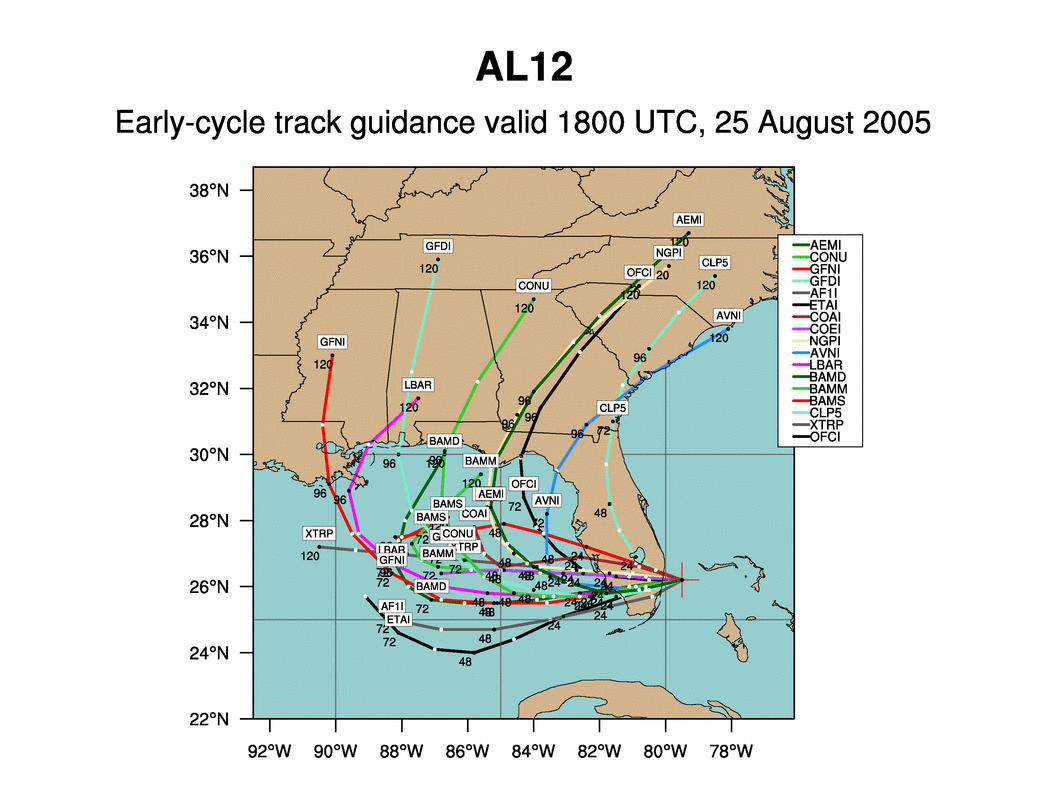
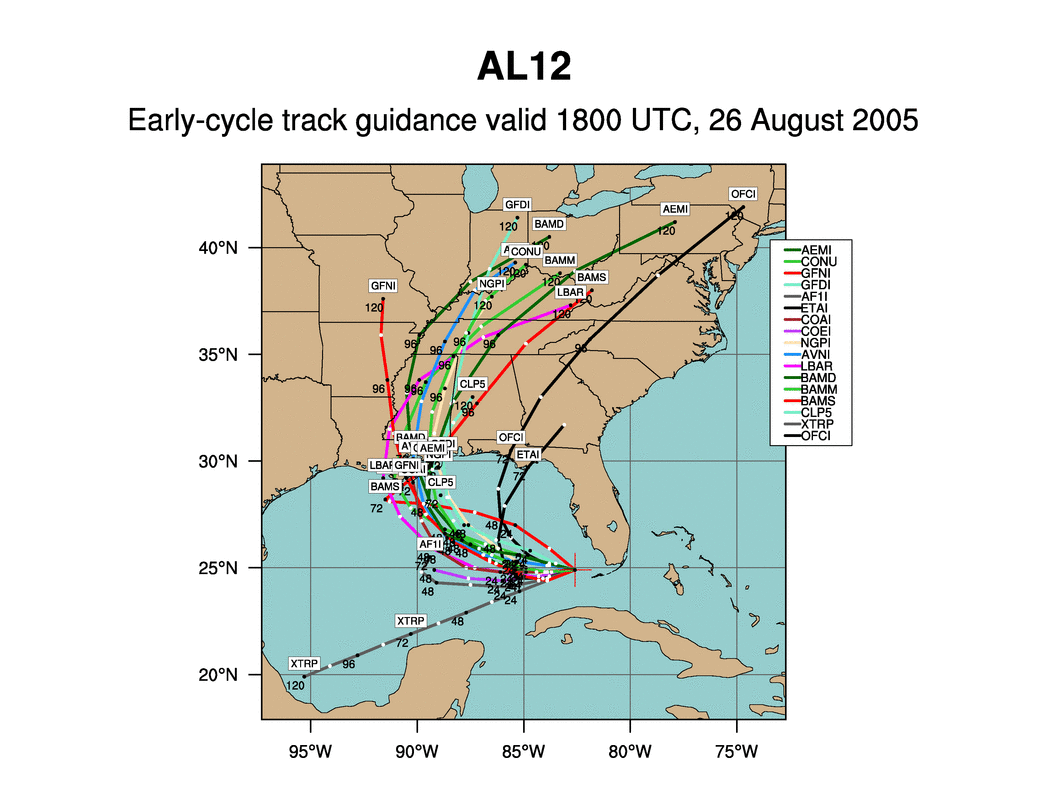
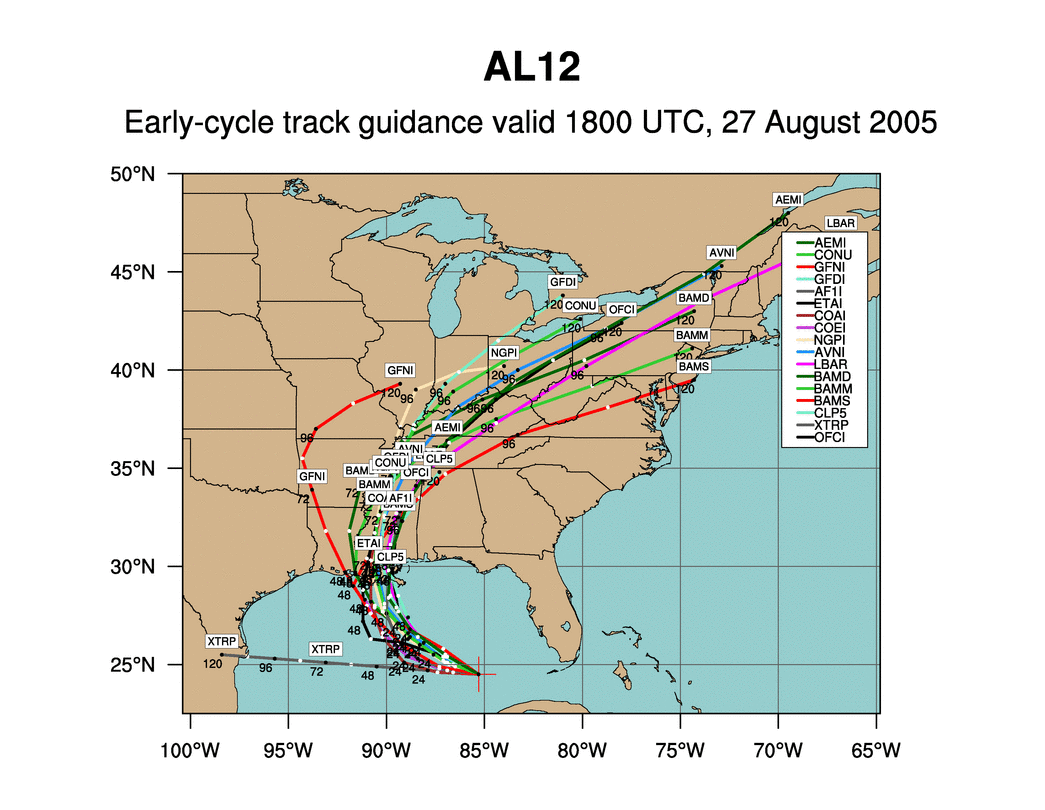
In fact, here is the progression of spaghetti models for Katrina from the 23rd through the 27th. Notice in each one, there is indication that Katrina was not going to turn immediately.
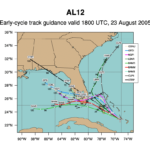
Six days out 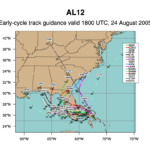
Five days out 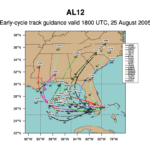
Four days out 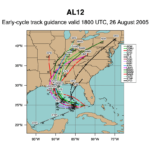
Three days out 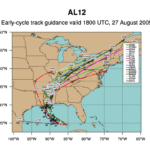
Two days out
I think original problem with the forecast may have been more a function of misunderstanding the cone, the model data, plus poor messaging from local media outlets. If so, that means miscommunication could be how we got to the Katrina Response. Someone once told me, “A great forecast that no one understands is a bad forecast.”
So, perhaps the forecast was decent, but no one understood it? That still doesn’t mean the on-paper forecast was inaccurate, though. And, I would argue, shouldn’t delegitimize future forecasts.
And while the Katrina Response is often to the forecast track, the forecast for the intensity was where the forecast wasn’t the best. Most early model guidance at the time kept Katrina as a Hurricane but not a Major Hurricane at landfall. But rarely is that why people refute the NHC forecast. It always comes back to the track.
Meteorology and the Six Million Dollar Man
If you are still skeptical of hurricane forecasts because of Katrina, let’s come at this from another angle. Even if that one was bad, it doesn’t mean that 12 years later forecasts are going to still be bad.
This is something that people may not consider. Meteorology is no different than any other industry. While industries change and grow people accept it and enjoy the new gadgetry that evolves from it.
HDTV, smartphones, hybrid cars, Wifi, 3D printing, drones, the list goes on. The electronics and automotive industries are probably the best examples of innovation to the casual observer.
In 2005, the United States Government just passed the Digital Transition and Public Safety Act to make the change to all HDTV. In 2005, a smartphone was still called a PDA and only the nerdiest of the nerds owned them (myself included), The Prius was only in its second generation, Wifi was still at in the WAN-B/G at 54Mbps with weak signals, 3D printing wasn’t even a thing and the word “drone” was something out of science fiction or used as a adverb to describe long-winded professors.
Humans have made some pretty cool advances since 2005.
Why would the weather world be any different? To imply meteorologists haven’t learned anything, gained any extra understanding, or developed new technologies in a dozen years is to imply that those scientists are, well, stupid. And that’s just not true.
Meteorological data is more robust, Weather models are run on computers that are faster, and researchers have dissected past events sharing their findings with the field. The data is better, the solutions come faster, and the evidence for forecasts is stronger – we are better, stronger and faster.
Your Apple Watch is proof that forecasts are better
Think about how far technology has come in 12 years. In 2005, the best processor we had running in servers was, like, a 64-bit Intel Xeon MP. It had one core and was running at 3.33 GHz. Now, we have Intel Xeon Platinum 8180 Processor. It has 28 cores and those run – simultaneously – at 3.8 GHz. The max RAM possible on the MP was 144GB. The Platinum? A whopping 768GB.
Take a look at the computer model output from 2005 for Katrina. Below is a look at the “Spaghetti Model Plots” meteorologists use – and sometimes show on TV – to display possible outcomes, or the trend, or the possibilities of placement for any particular storm.
In the case below, we are look at Katrina.
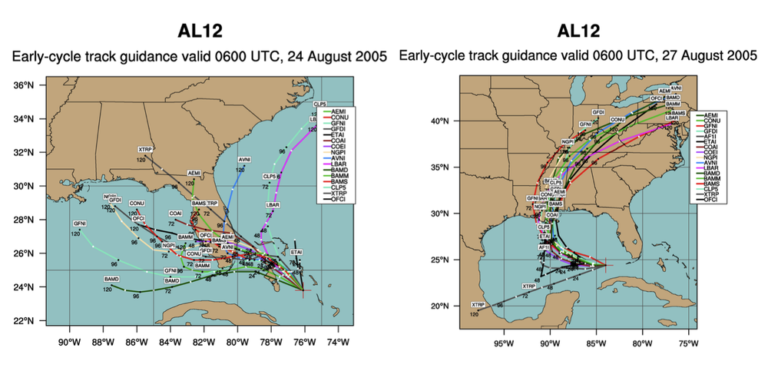
Look at the spread in the image on the left. Pretty decent. Anywhere from the southern Gulf to the open Atlantic. Things got a bit tighter on the right. Once Katrina was an established hurricane, the model data that was put into the computers was able to kick out a better forecast.
Remember those five spaghetti models from above?
Compare that to the forecasts above. And you can start to see that not only did the forecast alert those who would be eventually impacted by the storm, but it also followed the best available data, too.
Well in 2017, the improved computing power means the model output (computer suggested forecasts) meteorologists use can be rendered quicker, look into the future further, and can calculate that output with more data inputs, too. The result is a end-forecast that is more accurate, over a greater period of time, taking into account more variables.

So while the above image may look like a jumbled mess, think about what that signifies. All of the extra computing power is adding evidence to the forecast, increasing confidence that the storm will go a particular way. Outliers are often discredited, but not disregarded. And meteorologists compare forecast output tracks like this against atmospheric parameters, too. And that is how the forecast is created.
That Facebook post, accompanying video, and messaging
This is my favorite cherry-picking throw meteorologists under the bus type of thing that I’ve seen in quite some time. If you haven’t seen it, you can watch it here:
Poor Dan Thomas. He didn’t deserve this to get as much run as it is getting. More than 90,000 views? Spreading like wildfire on Facebook?
Here is the thing. If you listen to his words and not just look at the pictures, he tries to leave the door open, but his tone is casual, so it likely didn’t resonate with people like it should.
– “As I said all day yesterday, I wouldn’t be surprised if this track jogs a little further west”
– “She may make it pretty far west into the Gulf of Mexico before turning sharply north”
– “I think a little west of the official track”
He said he didn’t think it would become a problem for New Orleans, as it was an unlikely scenario, but he also didn’t say impossible and zero-percent chance.
And I understand it sounds like I’m splitting hairs. Cherry-picking the only the parts that help my argument. But so is watching one video, of one forecast, from one TV station about a hurricane that affected – at least – six television markets with multiple TV stations in those markets, with multiple newscasts per day, given by multiple different meteorologists and weather people.
So, if the argument of “look at this one video, though!” is valid, then so is mine.
And to his credit, this was Thursday night, four days before Katrina made landfall. The forecast was different the next night when he got on the air.
Back to Irma
There were a lot of people who would look at the forecast for Irma and give the Katrina Response. This was not constructive – for anyone. As I stated above, it really put a lot of people- who wouldn’t have been anxious – under a lot of undue stress. For days. And it caused people who needed to act, to hesitate.
The people claiming the Katrina Response saw this:
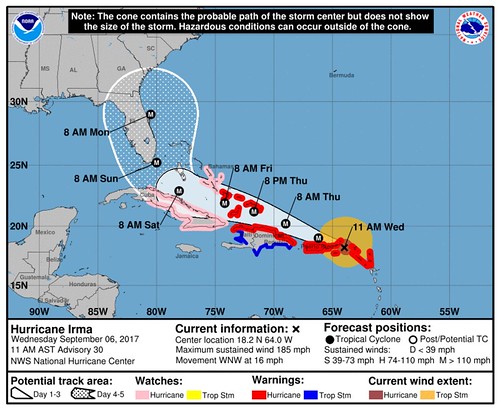
And this:
And thought, I’ve seen this before. This is just like Katrina.
But, this wasn’t like Katrina.
Because the forecast for Katrina, at the same relative time, looked like this:

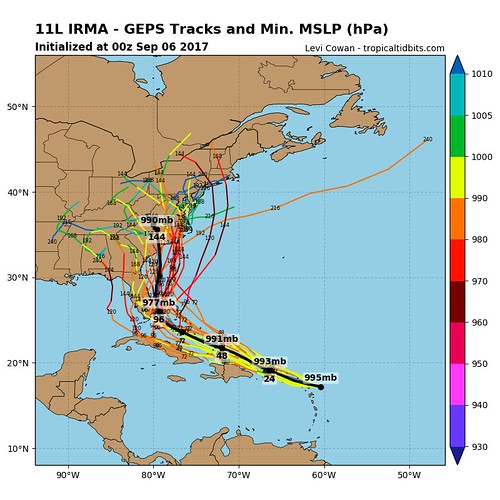
And the spaghetti models looked like this:

The biggest difference was the coast of Mississippi was in Katrina’s cone at this point, the spaghetti models showed some models that bring the storm toward the coast. In the case of Irma, the cone was about 300 miles to the east.
And the nearest spaghetti model was 250 miles to the east, too. And it might be tough to see, but the distance between the two most outlier spaghetti models for Irma at 96 hours out? Just about 300 miles. At the same point in time for the spaghetti models for Katrina? More than twice that!
Of note: The mean forecast line (black line) on the model forecast model for Irma above got within 85 miles of the actual point where Irma was at 96 hours from the model output. Pretty good.
And there have been multiple hurricanes forecast to turn since Katrina. And I don’t recall them getting as much attention as Irma. In fact, just last year Hurricane Hermine and Hurricane Matthew both took hard right turns – as forecast – with very few Katrina Response replies.
So what’s your point, Nick?
I’m not here to tell you your feelings aren’t natural – something bad happened that wasn’t expected, ouch! But feelings and facts can be separate. The facts show that the forecast for Katrina wasn’t inaccurate.
If you choose to disregard forecasts today because of what happened with Katrina you are doing a disservice to yourself. The forecast was decent and forecasts are even better today. It is okay to be cautious, but reacting to a forecast with doubt because the forecast for Katrina was “bad” isn’t a reaction based on facts. And when life-saving decisions need to be made, fact-based decisions are always best.
That said, to borrow a line from one of my favorite movies (The Matrix: Reloaded), when it comes to challenging established personal beliefs “I don’t bother making points. There’s no point.“
I understand that some people are never going to change their mind. And that’s anticipated. And fine. But for those who choose to be open-minded or came, curious about this whole thing, hopefully this breakdown helps you trust forecasts a bit more in the future. Because all I’m really after is helping you rest a bit easier at night while also making better decisions when the time comes.
Are we always going to get it right on the nose? Sadly no. My prediction: We won’t ever get the forecast right 100-percent of the time.
But, hey, we “didn’t get Katrina right, so who knows?”


