Generally the area picked up between 3″ and 5″ of snow. A bit more than what we were thinking 24 hours ahead of the event. We forecast 1.5″ of snow while the local NWS office had 2″ of snow. That said, our totals were still less than the models that showed 7″ to 9″ across the area.
A lot of friends, neighbors, viewers, readers of this website, were pretty excited about all the snow. And want to know, what the recipe was that got the area so much snow. And now wonder, “how can this happen again?”
Well, first, let’s figure out exactly how we got here.
Quick notes
1. The liquid ratio of the snow was 6:1 in our area. Generally it is 10:1, and that is usually what meteorologists and computer models use to figure out how much snow will accumulate.
In our case, that means for every one inch of rain, you got about six inches of snow. That is pretty “wet” snow. And therefore, very heavy. And explains why so many trees came down.
2. Because we ended up with more moisture, we ended up with more precipitation over-running the cold air. Because of that, we ended up with more snow. Makes sense. But the coolest part is the science behind that…
NERD ALERT!
I talked on facebook about the ‘elbow’ of the trough sagging a bit further south and how the recoil from that allowed more moisture to surge north into the colder air, and that created a little area where higher snow totals were possible.
If you don’t want to watch the video, in summary, think of it like whipping a garden hose. Pushing down further on one end, recoils the other end to go higher. Check out the illustrations below:
But that was only part of the story.
The Ridge of high pressure to our southeast nudged a bit further toward us as noted by Philippe Papin.
What happened w/ overperforming overrunning #snow event? Possible culprit is poorly forecasted SE ridge off EUS, shifting s/w inland & more amped. Warm SSTAs may have aided ridge amplification via LHR offshore on bc zone. Result: A consistent +500 geo height trend in GEFS & GFS. pic.twitter.com/cWFlYw6Vcz
— Philippe Papin (@pppapin) December 9, 2017
He also mentions the warmer sea-surface temperatures. In general, the warmer the SSTs, the higher the natural dewpoint equilibrium between the ocean and the air becomes – meaning more available moisture in the atmosphere.
Well, once the atmosphere starts nudging different areas of pressure around, things are going to start to look drastically different than were previously thought.
And then, with the moving pressure, it is also moving moisture around and into places where we didn’t think it would be. And because water has a higher specific heat (remember that from chemistry class?) it is tougher to change its temperature. So when we ended up with more moisture at certain levels the atmosphere, it ended up keeping that level cooler.
On top of that, because we started shoving warmer, more moist air a bit further north, it is going into a place where the air above it was quite bit cooler. Warm air under cold air? Wait a second! That is going to make the warm air rise. In fancy meteorological terms, we increased the Vertical Velocity in the atmosphere. That means, the atmosphere is set up to – more naturally – move air from lower levels into higher levels, cooling and condensing it.
If you cool and condense air enough, eventually you end up with precipitation!
And look at the change in model data from Thursday afternoon to Friday morning.
The maps show the layer of the atmosphere where snowflakes are being built. And the red shaded areas show where there is the most Vertical Velocity is occurring. Notice the NW shift, between the maps from left to right, in just a few hours plopping a lot of vertical motion over south Mississippi, in the layer of the atmosphere where snowflakes are being made.
So, now the atmosphere started making snowflakes up at 18,000 feet. Really wet snowflakes (and we know that now since the data shows it was a 6:1 ratio). And those snowflakes had a temperature between -10F and -20F.
And the atmosphere is building them more often, and more quickly, than originally thought.
Then those snowflakes become too big and heavy to be held up by the increased Vertical Velocity noted above… and start to fall. Once they fall, others are built in their place. And this happens over, and over, and over, and over.
Here is a look at the Skew-T:
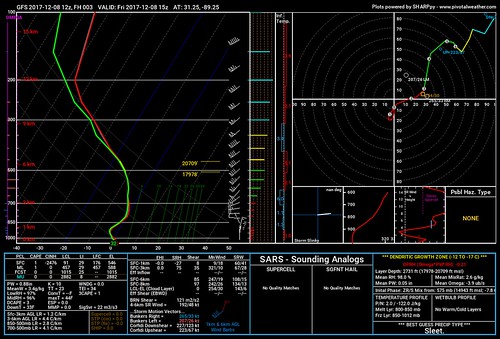
Notice that the red line and the green line are right on top of each other. from almost top to bottom. That means the “column is saturated” and likely precipitating.
Well, the abundant number of extra snowflakes, that are made of water, that have a high specific heat, that means it is harder to change their temperature, fall into the atmosphere below (around 3,000 to 9,000 feet) that is around freezing.
Here is a zoom in on the Skew-T from the ground up to 8,000 feet.
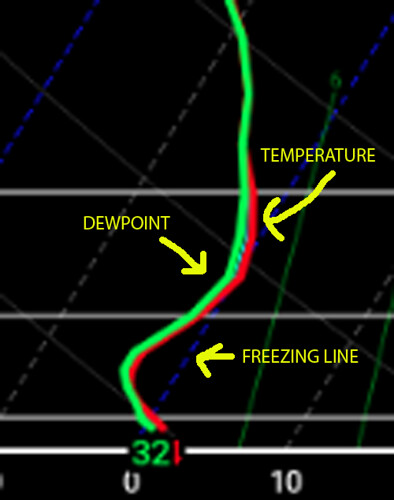
The blue dashed line is the freezing line, so any time the temperature is on the right side of it, you should be melting snowflakes.
BUT!
Because the air was not completely saturated, it meant that as the cold snowflakes fell through that level of the atmosphere, they could cool the air through evaporative cooling (or wet-bulbing). And that is exactly what happened. The snowflakes that were -10F to -20F were very wet, and thus cooled the atmosphere as they fell. Keeping the melting layer in the atmosphere, that the south usually as, below freezing. That let all of the snowflakes reach the surface.
Thus, leaving the area with 3″ to 5″ of snow.
How close were we to seeing no snow at all? That’s tough to say, but I bet if up at about 5,000ft the air was as little as one or two degrees warmer, there would’ve been sleet, and very little to no snow accumulation.
And that was the expectation. But because we had a few things wiggle a little, it caused all of the dominos to fall in a way that led to 3″ to 5″ of snow for south Mississippi.
Now that we know WHAT happened, what did we learn?
Sadly, not enough. I wish I could say with any certainty that we simply “missed” one big thing, and that explains it all, but that wasn’t the case. This was more a case of right-thing-at-right-time and poor model guidance until the short-term.
But that is how it is in the South with snow. Usually you aren’t going to know until about 24 hours out – if that. And the model guidance that simply shows snow a few days out, can’t be trusted. Because most of the time it is small incremental data that simply can’t be resolved that far out that determines if it will snow or not.
But here are some take home points:
1. Communicate variables better and what that means for the outcome.
This has nothing to do with putting together the forecast, but I think this is probably the biggest thing. A the TV station where I work, we’ve made some changes on the TV side that doesn’t give me the time to elaborate on the overall weather setup like I used to. So sharpening my communication skills and preparing everyone for all eventual outcomes is most important.
I’ve been considering a probabilities chart with the percent-chance of various snowfall amounts. In this case, it would’ve prepared people for the eventual snowfall totals, because the percent-chance we got 5″ of snow was low, but wasn’t zero.
2. Sea-surface temperatures under the southerly flow matter
This is something I watch closely with severe weather, but likely underestimated in this situation. Because this was a unique setup where we had gulf moisture streaming directly over the top of cold air, it had a larger impact than anticipated.
3. Vertical velocity under the Dendritic Growth Zone isn’t as important
We had, like, zero vertical motion under the DGZ. I definitely thought that would limit transport of moisture from the lower levels into the area where we were building snowflakes. That ended up being irrelevant because there was plenty of vertical moisture through that region, anyway, despite the lack of motion below it.
So, how do we do this again?
Very carefully! Based on the record books, this was a once-in-a-100-year kind of an event. The last time we saw this much snow – officially – was 1893. That doesn’t mean it can’t happen tomorrow, but the likelihood that all of the moving parts come together like this again, is quite low.
Furthermore, this isn’t an A-Typical way to get snow to fall in south Mississippi. I suppose the area just got lucky.
Okay, well… When will it be cold again?
If things line up right… around Christmas. Take a look at the ECMWF Ensemble for Christmas Eve:

This shows the 500mb geopotential heights. Basically showing where troughs (cooler air) and ridges (warmer air) will be. It shows a decent trough over the east coast, meaning we would be on the cooler side of things.
For a comparison, this is what the same model showed for Friday morning while it was snowing:
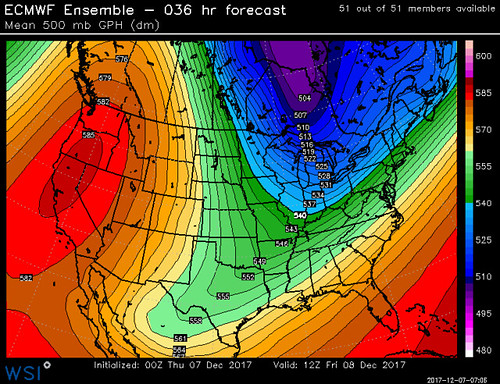
While there are similarities, I’m not ready to say anything with any certainty yet. But a cooler than average Christmas may be on tap. We’ll be keeping a close eye on things!


